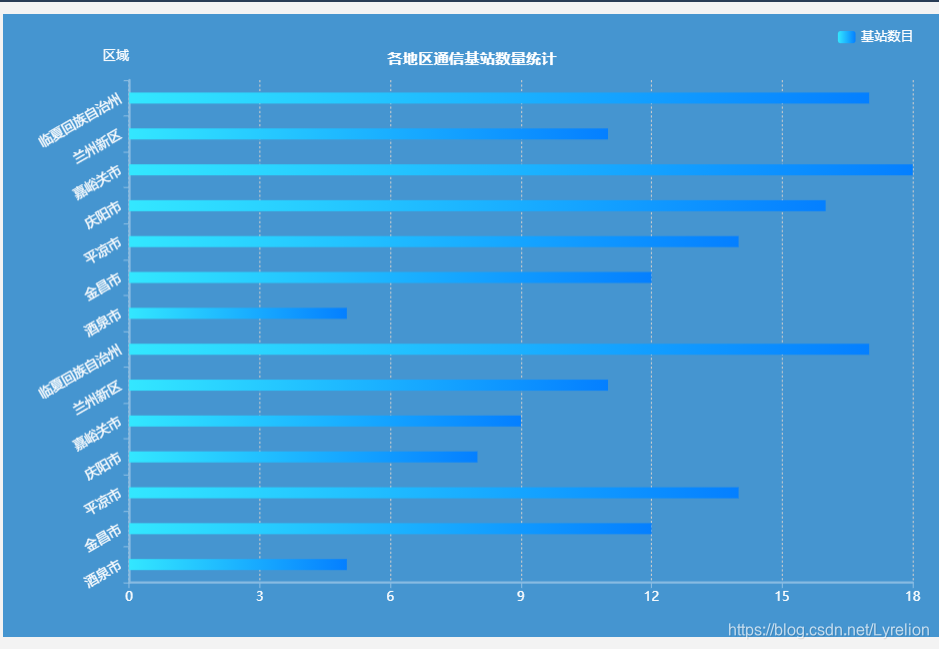
series 绘制图表本身
- name: '基站数目',
- type: 'bar',:图表类型(柱状、折线…)
- 是否在柱形图上显示数字 :label: { show: false, position: 'insideRight', ... }
- 设置柱状图宽度:barWidth
-
实现柱状体渐变色:
// itemStyle: {
// normal: {
// color: new echarts.graphic.LinearGradient(
// 1, 0, 0, 0, // 表示从上到下
// [
// {offset: 1, color: '#33e7ff'},
// {offset: 0, color: '#047fff'}
// ])
// }}, - 1, 0, 0, 0 // 表示从上到下
- 0, 1, 0, 0 // 表示从下到上
- 0, 0, 1, 0 // 表示从左到右
- 0, 0, 0, 1 // 表示从右到左
- 删了上面的 itemStyle,柱状图就会自动读取 color,变为纯色图表
option = {
    backgroundColor:'#4595d0',
    title:{
        text:'各地区通信基站数量统计',
        x:'center',
        top:30,
        textStyle:{
            color:'#fff',
            fontSize:14
        }
    },
    tooltip: {
        trigger: 'axis',
        // 鼠标滑过存在阴影
        axisPointer: {
            // type: 'shadow'
        },
        textStyle: {
            fontSize: 10
        }
    },
    legend: {
        data: ['基站数目'],
        right:20,
        top:10,
        // 图例图案的宽高
        itemWidth:16,
        itemHeight:11,
        textStyle:{
          color:'#fff',
          fontSize:12
        }
    },
    color:['#0bffcc'],
    grid: {
        left: 28,
        right: 26,
        bottom: 30,
        containLabel: true
    },
    xAxis: {
        type: 'value',
         splitLine:{
            show:true,
            lineStyle:{
                type:'dotted'
            }
        },
        axisLine:{
            lineStyle:{
                color:'#8abce2',
                width:2
            }
        },
        axisLabel:{
            color:'#fff',
            fontSize:12,
            // 单位
            // formatter: '{value}(个)'
        },
        data: [0, 3, 6, 9, 12, 15, 18]
    },
    yAxis: {
        type: 'category',
        name: '区域',

        nameTextStyle: {
            color: '#fff',
            fontSize: 12,
            align:'right',
        },
        nameLocation: 'end',
        // y轴分割线
        splitLine:{
            show:false
        },
        axisLine:{
            lineStyle:{
                color:'#8abce2',
                width:2
            }
        },
        axisLabel:{
            rotate: 30,
            color:'#fff',
            fontSize:12
        },
        data: [
                '酒泉市', '金昌市', '平凉市',
                '庆阳市', '嘉峪关市', '兰州新区',
                '临夏回族自治州','酒泉市', '金昌市',
                '平凉市', '庆阳市', '嘉峪关市',
                '兰州新区', '临夏回族自治州',
              ]
    },
    series: [
        {
            name: '基站数目',
            type: 'bar',
            label: {
                // 是否在柱形图上显示数字
                show: false,
                position: 'insideRight',
            },
        // 设置柱状图大小
            barWidth : 10,
            // 下面是渐变色的柱体
            // itemStyle: {
            //     normal: {
            //         color: new echarts.graphic.LinearGradient(
            //             1, 0, 0, 0,
            //             [
            //                 {offset: 1, color: '#33e7ff'},
            //                 {offset: 0, color: '#047fff'}
            //             ]
            //         )
            //     }
            // },
            data: [5, 12, 14, 8, 9, 11, 17,5, 12, 14, 16, 18, 11, 17]
        }
    ]
};
option = {
    backgroundColor:'#fff',
    title:{
        text:'aa',
        x:'center',
        top:10,
    },
    tooltip:{
        trigger: 'axis',
    },
    legend: {
        data: ['a', 'b', 'c', 'd', 'e', 'f', 'g', 'h'],
        right:20,
        top:10,
        itemWidth:16,
        itemHeight:11,
        textStyle:{
          color:'#333',
          fontSize:12
        }
    },
    color: [
           '#ffd8a8','#3bbc3d','#eb5c5a','#ffaa44',
           '#fcc662','#a886fe','#008df0','#72e1ff',
          ],
    xAxis: {
        type: 'category',
        axisLine:{
            lineStyle:{
                color:'#cbcbcb'
            }
        },
        axisLabel:{
            color:'#333',
            fontSize:12
        },
        data: ['Mon', 'Tue', 'Wed', 'Thu', 'Fri', 'Sat', 'Sun']
    },
    yAxis: {
        type: 'value',
        splitLine:{
            show:false
        },
        axisLine:{
            lineStyle:{
                color:'#cbcbcb'
            }
        },
        axisLabel:{
            color:'#333',
            fontSize:12
        },
        splitArea:{
            show:true,
            areaStyle:{
              color:['#fff','#f5f6fa']
            }
        }
    },
    series: [{
        data: [120, 20, 150, 80, 70, 110, 130],
        type: 'bar',
        name:'a'
    },
    {
        data: [120, 200, 150, 80, 70, 110, 130],
        type: 'line',
        name:'b',
        symbolSize:6
    },
    {
        data: [100, 200, 10, 80, 70, 110, 130],
        type: 'line',
        name:'c',
        smooth:true,
        symbolSize:6
    },
    {
        data: [120, 280, 150, 80, 70, 110, 130],
        type: 'bar',
        name:'d'
    },
    {
        data: [120, 200, 150, 80, 70, 110, 10],
        type: 'bar',
        name:'g'
    },
    {
        data: [90, 200, 150, 80, 70, 11, 130],
        type: 'bar',
        name:'f'
    },
    {
        data: [110, 100, 120, 60, 7, 100, 100],
        type: 'line',
        name:'e',
        symbolSize:6,
        areaStyle:{
           color: new echarts.graphic.LinearGradient(0, 0, 0, 1, [{
                offset: 0,
                color: 'rgba(0, 141, 240, 0.8)'
            }, {
                offset: 1,
                color: 'rgba(0, 141, 240, 0.3)'
            }])
        }
    },
    {
        data: [120, 200, 150, 9, 70, 110, 130],
        type: 'bar',
        name:'h'
    }]
};



 本文详细介绍了如何使用ECharts配置柱状图,包括图表样式、数据展示方式及交互效果等关键设置。通过具体配置项说明如何实现渐变色柱状图、调整柱子宽度及在柱形上显示数值等功能。





 扫一扫
扫一扫


 343
343

 被折叠的 条评论
为什么被折叠?
被折叠的 条评论
为什么被折叠?
 到【灌水乐园】发言