


一、Kubernetes日志收集
1、k8s有哪些日志需要收集
- 宿主机系统 & 安全日志
- 容器 stdout/stderr 业务日志
- Containerd/Docker 运行时日志
- K8S 控制平面:apiserver/etcd/ 调度器 / 控制器
- K8S 节点:kubelet、kube-proxy
- 集群 Event 事件 + 审计日志
- 网络:Ingress、CoreDNS、CNI 插件
- 业务应用 & 中间件自建日志
2、收集日志常用的技术栈
1、经典EFK(中小企业通用,最普及)
Filebeat + Elasticsearch + Kibana
Filebeat(日志采集):DaemonSet每个K8S节点部署一个
ElasticsearchI(日志存储,搜索引擎):存日志 + 全文检索引擎
Kibana(可视化页面):Web挂历查询界面
2、云原生轻量 Loki 栈(现在 K8S 首选)
FluentBit/Filebeat + Loki + Grafana
FluentBit / Filebeat (采集层)
Loki (日志存储 & 索引层,对标 ELK 里的 Elasticsearch)
Grafana (可视化 & 告警层,对标 ELK 里的 Kibana)
3、EFK
EFK简介
EFK 为容器化日志经典架构,由 Elasticsearch + Filebeat + Kibana 三组件组成,部署于 Kubernetes 集群 logging 命名空间,适配 TKE 容器集群全量容器日志采集、存储、检索与可视化。
组件职责
- Elasticsearch:分布式日志存储引擎,负责日志落地、分词、索引构建与全文检索。
- Filebeat:以 DaemonSet 全局部署在所有集群节点,作为轻量级日志采集端,采集宿主机容器标准输出日志。
- Kibana:日志可视化控制台,提供日志检索、条件过滤、时序图表、日志明细查看能力。
优点
- 原生支持容器 / K8s 元数据自动打标
- 全文检索能力强,适合业务日志模糊查询
- 架构成熟,运维生态完善
缺点
- Elasticsearch 内存、磁盘资源消耗高
- 按容器 + 日期拆分索引过多,运维管理繁琐
- 无自动日志生命周期清理,易占用大量磁盘
- Kibana 较重,查询语法相对复杂
EFK部署
环境说明
使用腾讯云的TKE服务,本地资源不够
| 节点名(内网 IP) | 节点版本 | 运行时(Runtime) | 配置规格 |
|---|---|---|---|
| 172.17.16.18 | v1.34.1-tke.5 | containerd | SA9.LARGE8 4 核 8GB 5Mbps,系统盘 50GB 通用型 SSD |
| 172.17.16.243 | v1.34.1-tke.5 | containerd | SA9.LARGE8 4 核 8GB 5Mbps,系统盘 50GB 通用型 SSD |
| 172.17.16.158 | v1.34.1-tke.5 | containerd | SA9.LARGE8 4 核 8GB 5Mbps,系统盘 50GB 通用型 SSD |
# 下载helm
[root@VM-16-18-tencentos ~]# wget https://get.helm.sh/helm-v4.1.4-linux-amd64.tar.gz
[root@VM-16-18-tencentos ~]# tar -zxvf helm-v4.1.4-linux-amd64.tar.gz
[root@VM-16-18-tencentos ~]# mv linux-amd64/helm /usr/local/bin/
安装 ElasticSearch
# 添加ElasticSearch仓库
[root@VM-16-18-tencentos ~]# helm repo add elastic https://helm.elastic.co

# 搜索可用的版本
[root@VM-16-18-tencentos ~]# helm search repo  elastic/elasticsearch  -l
NAME                 	CHART VERSION	APP VERSION	DESCRIPTION
elastic/elasticsearch	8.5.1        	8.5.1      	Official Elastic helm chart for Elasticsearch
elastic/elasticsearch	7.17.3       	7.17.3     	Official Elastic helm chart for Elasticsearch
elastic/elasticsearch	7.17.1       	7.17.1     	Official Elastic helm chart for Elasticsearch
elastic/elasticsearch	7.16.3       	7.16.3     	Official Elastic helm chart for Elasticsearch
elastic/elasticsearch	7.16.2       	7.16.2     	Official Elastic helm chart for Elasticsearch
elastic/elasticsearch	7.16.1       	7.16.1     	Official Elastic helm chart for Elasticsearch
......

# 拉取7.17.3版本
[root@VM-16-18-tencentos ~]# helm pull elastic/elasticsearch --version=7.17.3
[root@VM-16-18-tencentos ~]# tar -zxvf elasticsearch-7.17.3.tgz


# 安装
[root@VM-16-18-tencentos ~]# helm upgrade --install els -n logging ./elasticsearch --create-namespace --namespace logging
# 如果想指定别的storageClass就修改
helm upgrade elasticsearch elastic/elasticsearch \
  --namespace logging \
  --set volumeClaimTemplate.storageClassName=<你SC的名字>

# 查看pod状态
[root@VM-16-18-tencentos ~]# kubectl get pod -n logging -o wide
NAME                     READY   STATUS    RESTARTS   AGE     IP              NODE            NOMINATED NODE   READINESS GATES
elasticsearch-master-0   1/1     Running   0          9m33s   172.17.16.38    172.17.16.18    <none>           <none>
elasticsearch-master-1   1/1     Running   0          9m33s   172.17.17.160   172.17.16.243   <none>           <none>
elasticsearch-master-2   1/1     Running   0          9m33s   172.17.16.180   172.17.16.158   <none>           <none>
[root@VM-16-18-tencentos ~]# curl 172.17.16.38:9200/_cluster/health?pretty
{
  "cluster_name" : "elasticsearch",
  "status" : "green",
  "timed_out" : false,
  "number_of_nodes" : 3,
  "number_of_data_nodes" : 3,
  "active_primary_shards" : 1,
  "active_shards" : 2,
  "relocating_shards" : 0,
  "initializing_shards" : 0,
  "unassigned_shards" : 0,
  "delayed_unassigned_shards" : 0,
  "number_of_pending_tasks" : 0,
  "number_of_in_flight_fetch" : 0,
  "task_max_waiting_in_queue_millis" : 0,
  "active_shards_percent_as_number" : 100.0
}
安装Kibana
# 拉取7.17.3版本的Kibana
[root@VM-16-18-tencentos ~]# helm pull elastic/kibana --version=7.17.3
[root@VM-16-18-tencentos ~]# tar xf kibana-7.17.3.tgz

# 修改service的类型
[root@VM-16-18-tencentos ~]# vim kibana/values.yaml
service:
  type: NodePort  # 修改为NodePort
  loadBalancerIP: ""
  port: 5601
  nodePort: ""
  labels: {}
  annotations:

# 安装
[root@VM-16-18-tencentos ~]# helm -n logging upgrade --install  kibana ./kibana
[root@VM-16-18-tencentos ~]# kubectl get pod -n logging
NAME                             READY   STATUS    RESTARTS   AGE
elasticsearch-master-0           1/1     Running   0          19m
elasticsearch-master-1           1/1     Running   0          19m
elasticsearch-master-2           1/1     Running   0          19m
kibana-kibana-69f896f87b-xgbj2   1/1     Running   0          109s


# 查看Service
[root@VM-16-18-tencentos ~]# kubectl get svc -n logging
NAME                            TYPE        CLUSTER-IP       EXTERNAL-IP   PORT(S)             AGE
elasticsearch-master            ClusterIP   192.168.70.191   <none>        9200/TCP,9300/TCP   20m
elasticsearch-master-headless   ClusterIP   None             <none>        9200/TCP,9300/TCP   20m
kibana-kibana                   NodePort    192.168.34.245   <none>        5601:32710/TCP      2m37s
安装 Filebeat
# 拉取7.17.3版本filebeat
[root@VM-16-18-tencentos ~]# helm pull elastic/filebeat --version=7.17.3
[root@VM-16-18-tencentos ~]# tar xf filebeat-7.17.3.tgz


# 安装
[root@VM-16-18-tencentos ~]# helm -n logging install filebeat ./filebeat

# 查看pod
[root@VM-16-18-tencentos ~]# kubectl get pod -n logging
NAME                             READY   STATUS    RESTARTS   AGE
elasticsearch-master-0           1/1     Running   0          33m
elasticsearch-master-1           1/1     Running   0          33m
elasticsearch-master-2           1/1     Running   0          33m
filebeat-filebeat-2clng          1/1     Running   0          36s
filebeat-filebeat-lqsbr          1/1     Running   0          36s
filebeat-filebeat-tjmm7          1/1     Running   0          36s
也可以使用应用来创建索引
[root@VM-16-18-tencentos ~]# vim filebeat-values.yaml
daemonset:
  enabled: true
  filebeatConfig:
    filebeat.yml: |
      filebeat.inputs:
      - type: container
        paths:
          - /var/log/containers/*.log
        processors:
        - add_cloud_metadata:
        - add_host_metadata:
        - add_docker_metadata:
        - add_kubernetes_metadata:
            in_cluster: true
            host: ${NODE_NAME}
            matchers:
            - logs_path:
                logs_path: "/var/log/containers/"
        - add_fields:
            fields:
              index_name: "my_logs-%{[kubernetes.pod.name]}"

      setup.template.settings:
      index.number_of_shards: 1
      setup.template.enabled: true
      setup.template.name: "my_template"
      setup.template.pattern: "my_logs-*"
      setup.template.overwrite: true
      setup.ilm.enabled: false
      #output.console:
      #pretty: true
      output.elasticsearch:
        hosts: '${ELASTICSEARCH_HOSTS:elasticsearch-master:9200}'
        index: "%{[kubernetes.container.name]}-%{+yyyy.MM.dd}"

# 创建
helm upgrade filebeat -f filebeat/filebeat-values.yaml ./filebeat -n logging


最终生成的索引名 = 容器名 - 年月日
容器 A → 容器A-2026.05.09
容器 B → 容器B-2026.05.09
使用EFK
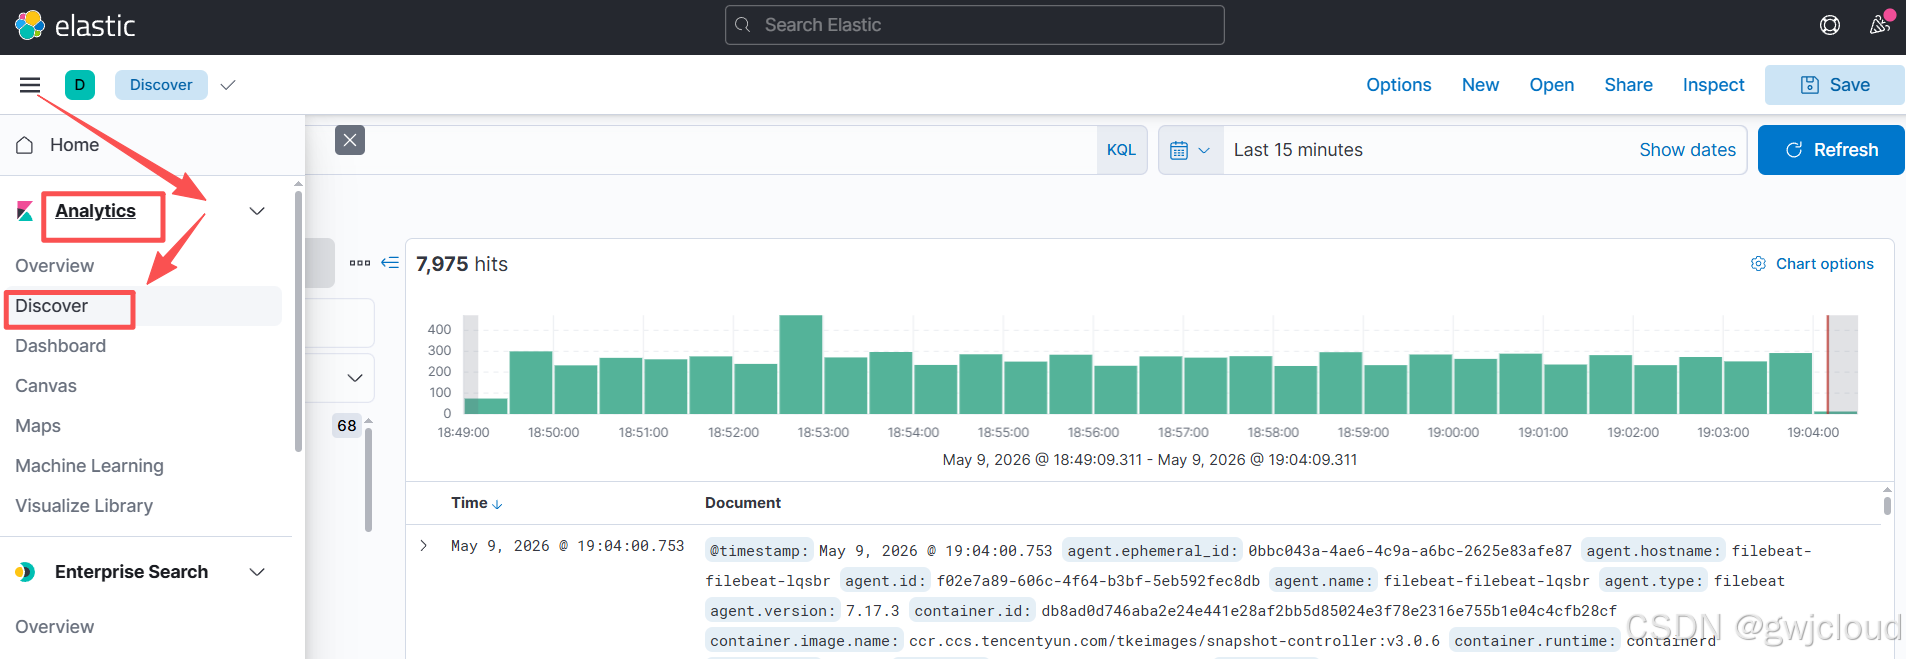
创建索引模式
左边点 菜单(三横)
找到 Stack Management / 栈管理
点 Index Patterns / 索引模式
点 Create index pattern / 创建索引模式
输入:filebeat-*
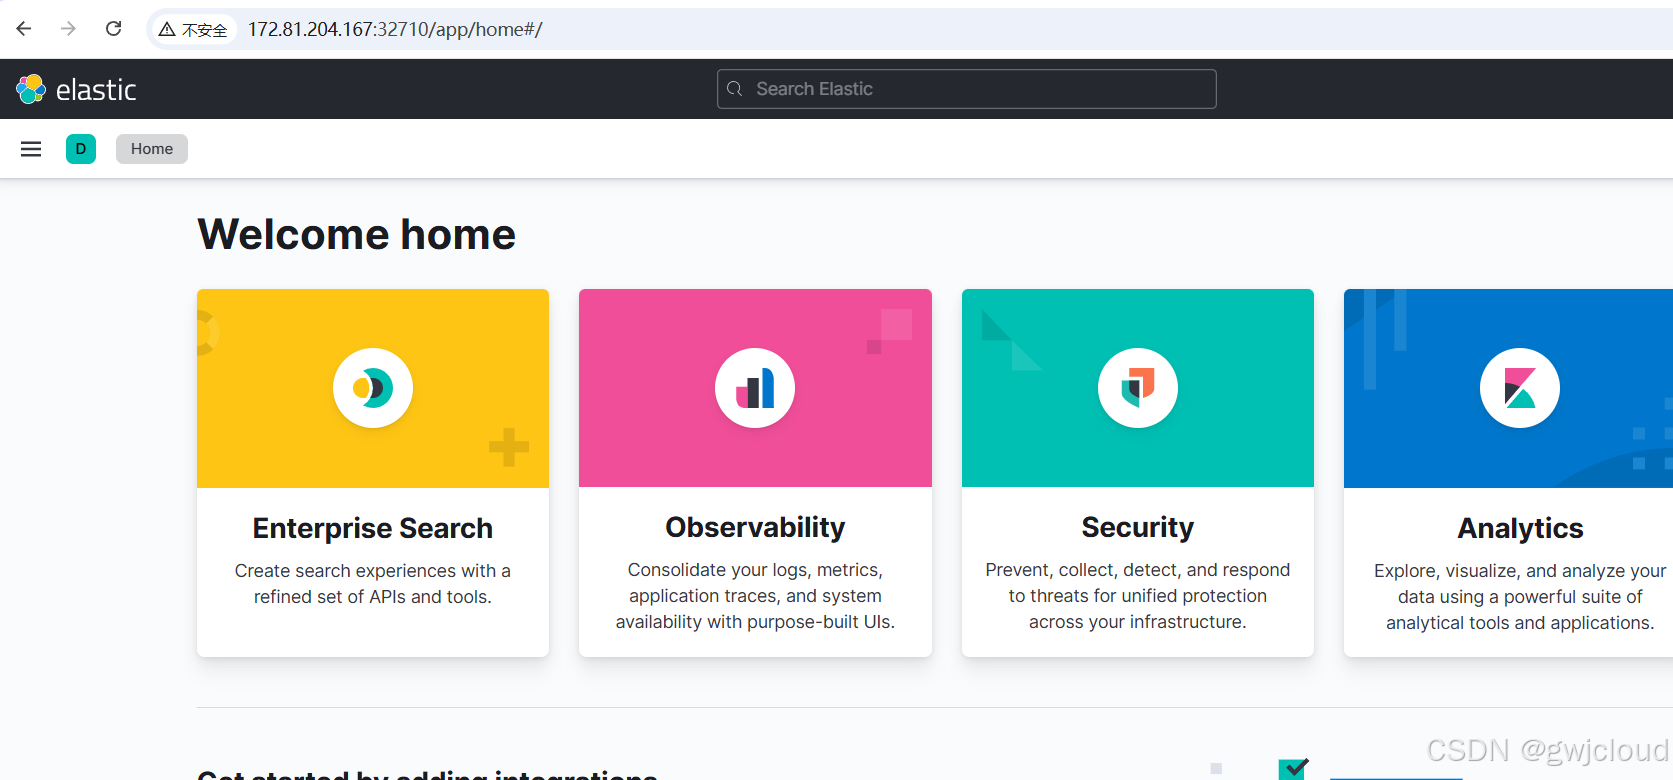
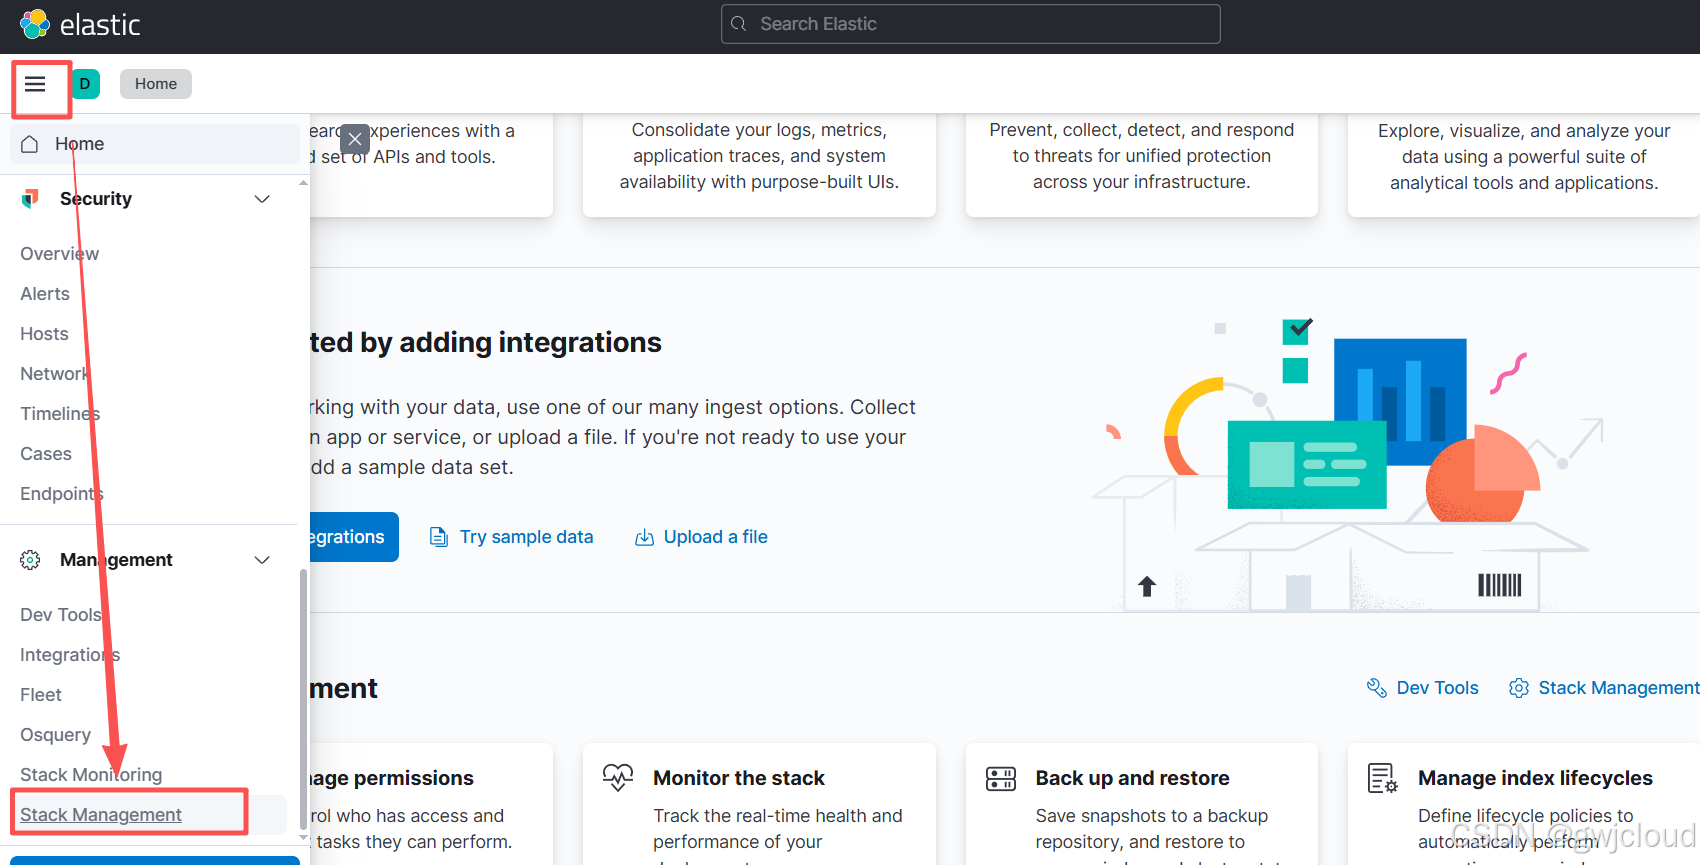
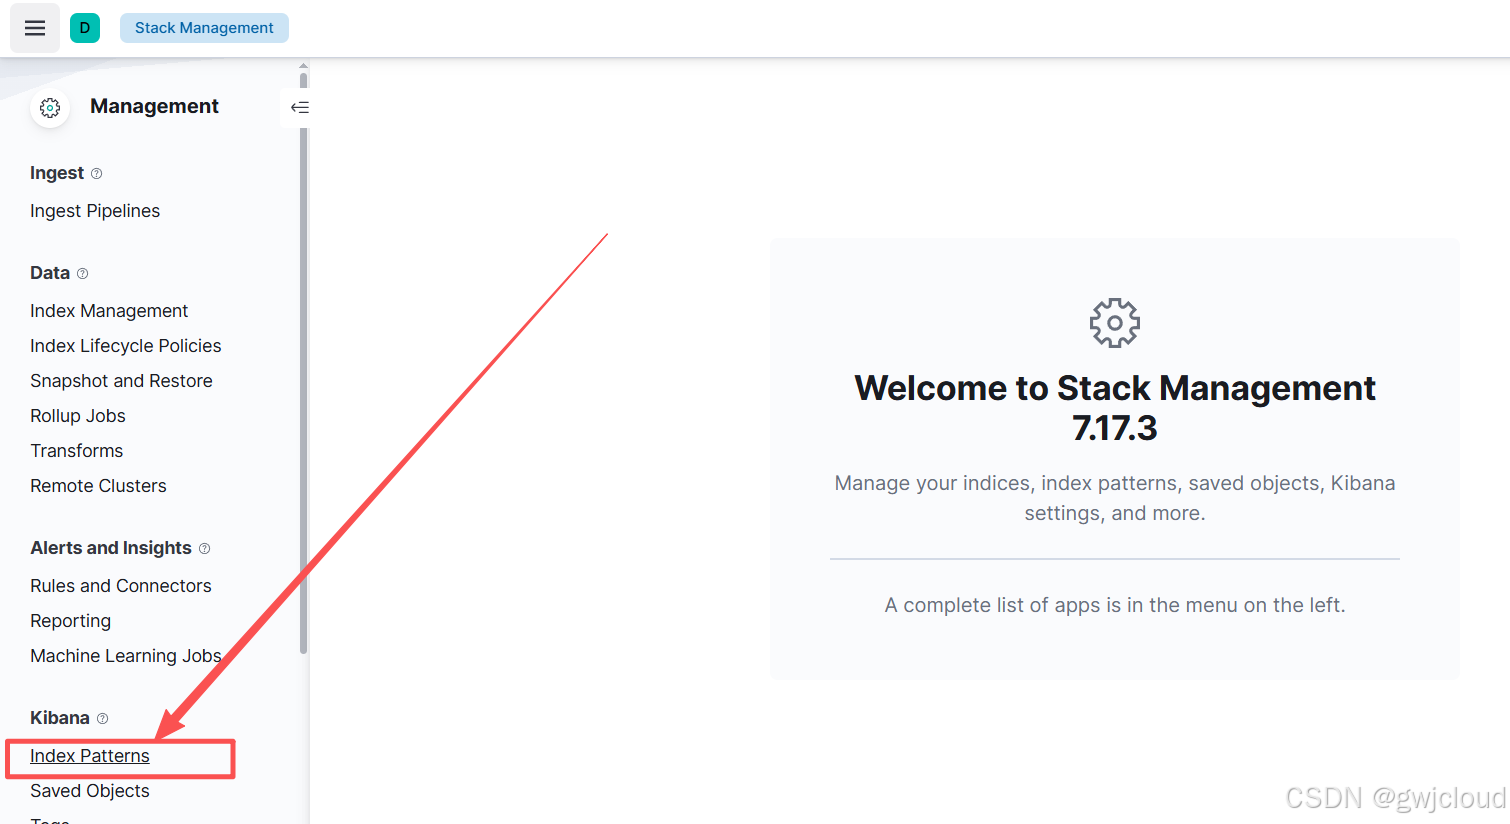
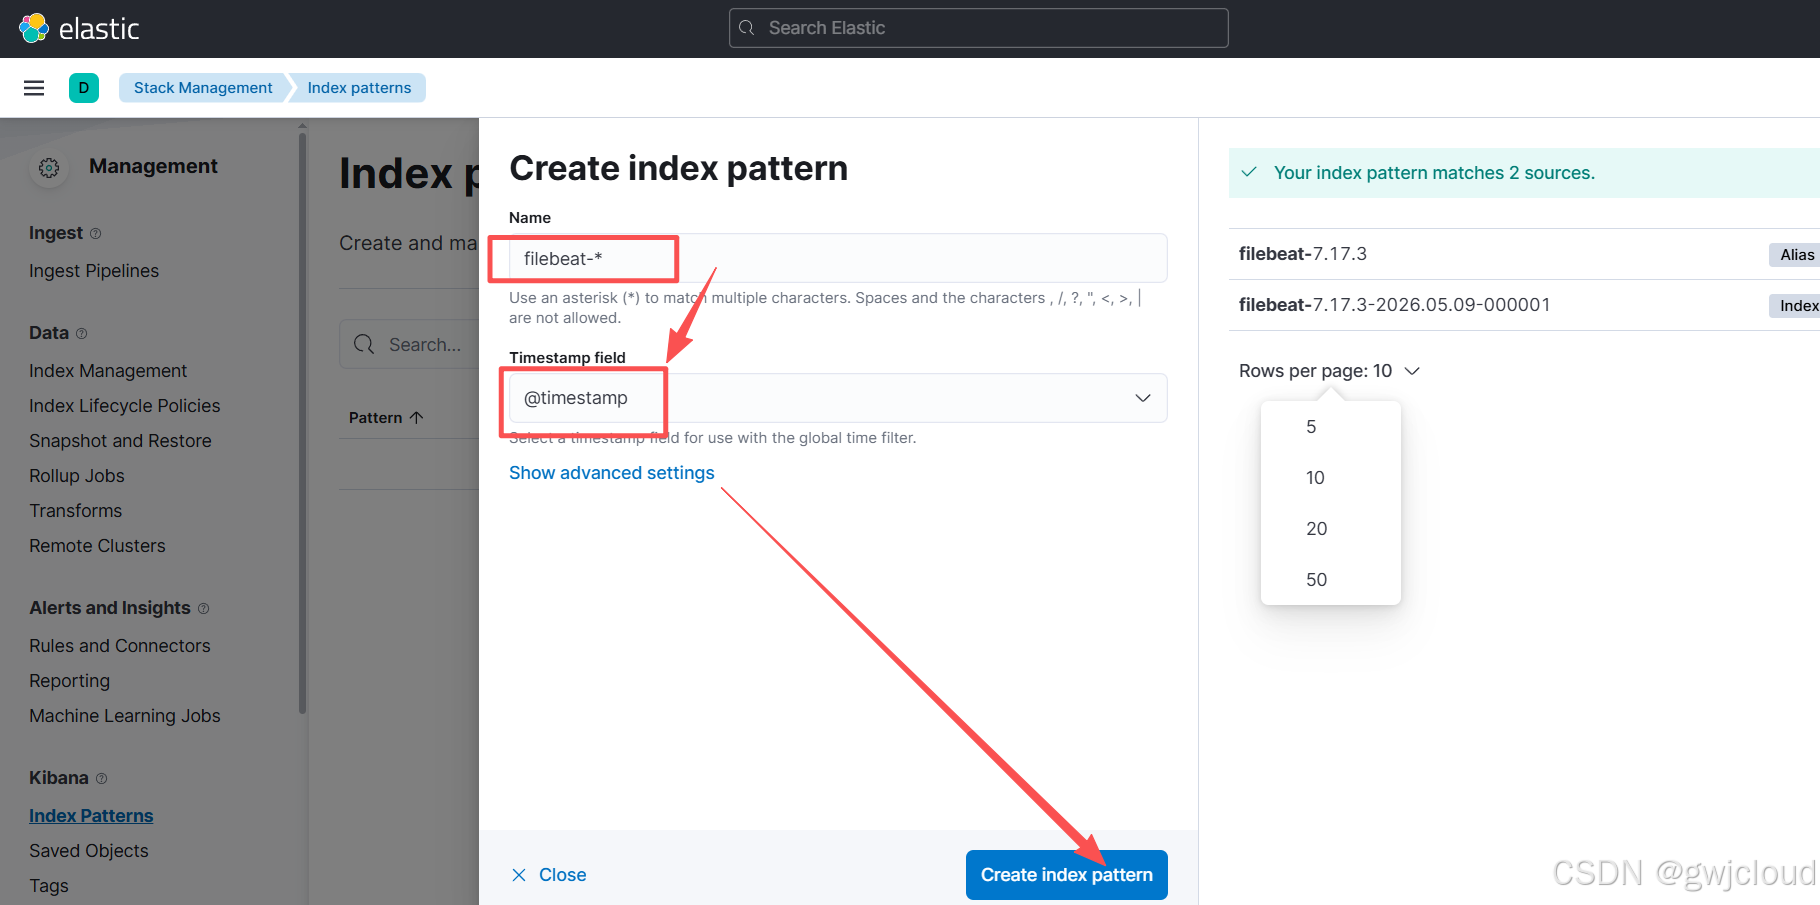
@timestamp 是日志自带的时间字段,Kibana 会用它来按时间线展示日志
# 创建测试pod来输出日志
[root@VM-16-18-tencentos ~]# kubectl create namespace tcloud

# 创建
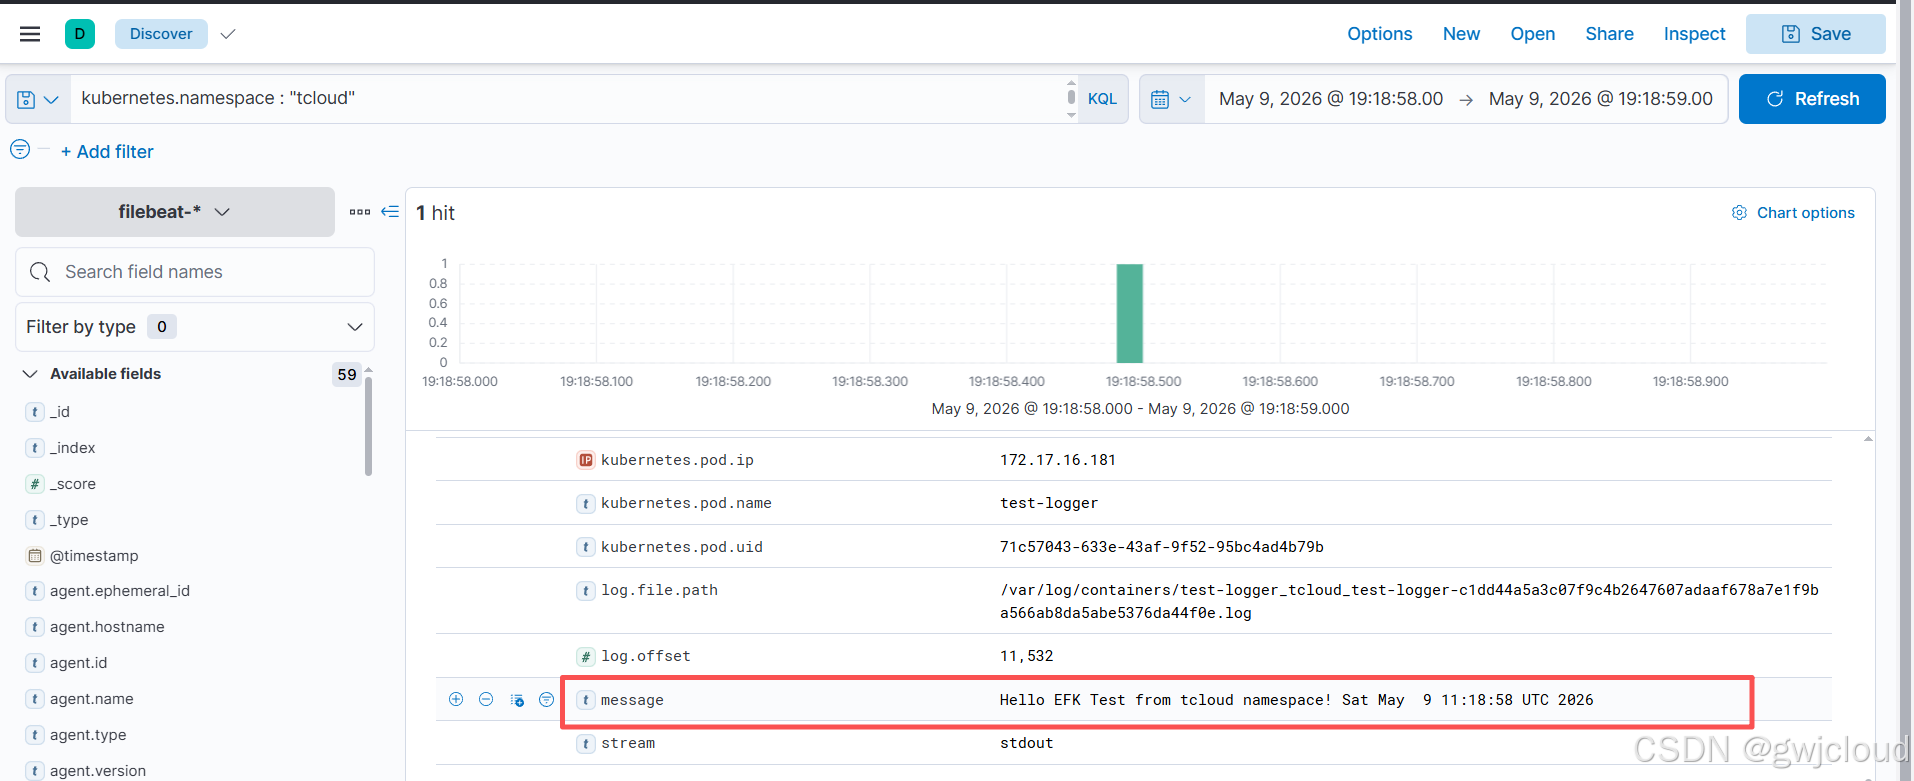
[root@VM-16-18-tencentos ~]# kubectl run test-logger -n tcloud --image=busybox --restart=Never -- /bin/sh -c 'while true; do echo "Hello EFK Test from tcloud namespace! $(date)"; sleep 1; done'
pod/test-logger created
[root@VM-16-18-tencentos ~]# kubectl get pod -n tcloud
NAME          READY   STATUS    RESTARTS   AGE
test-logger   1/1     Running   0          11s
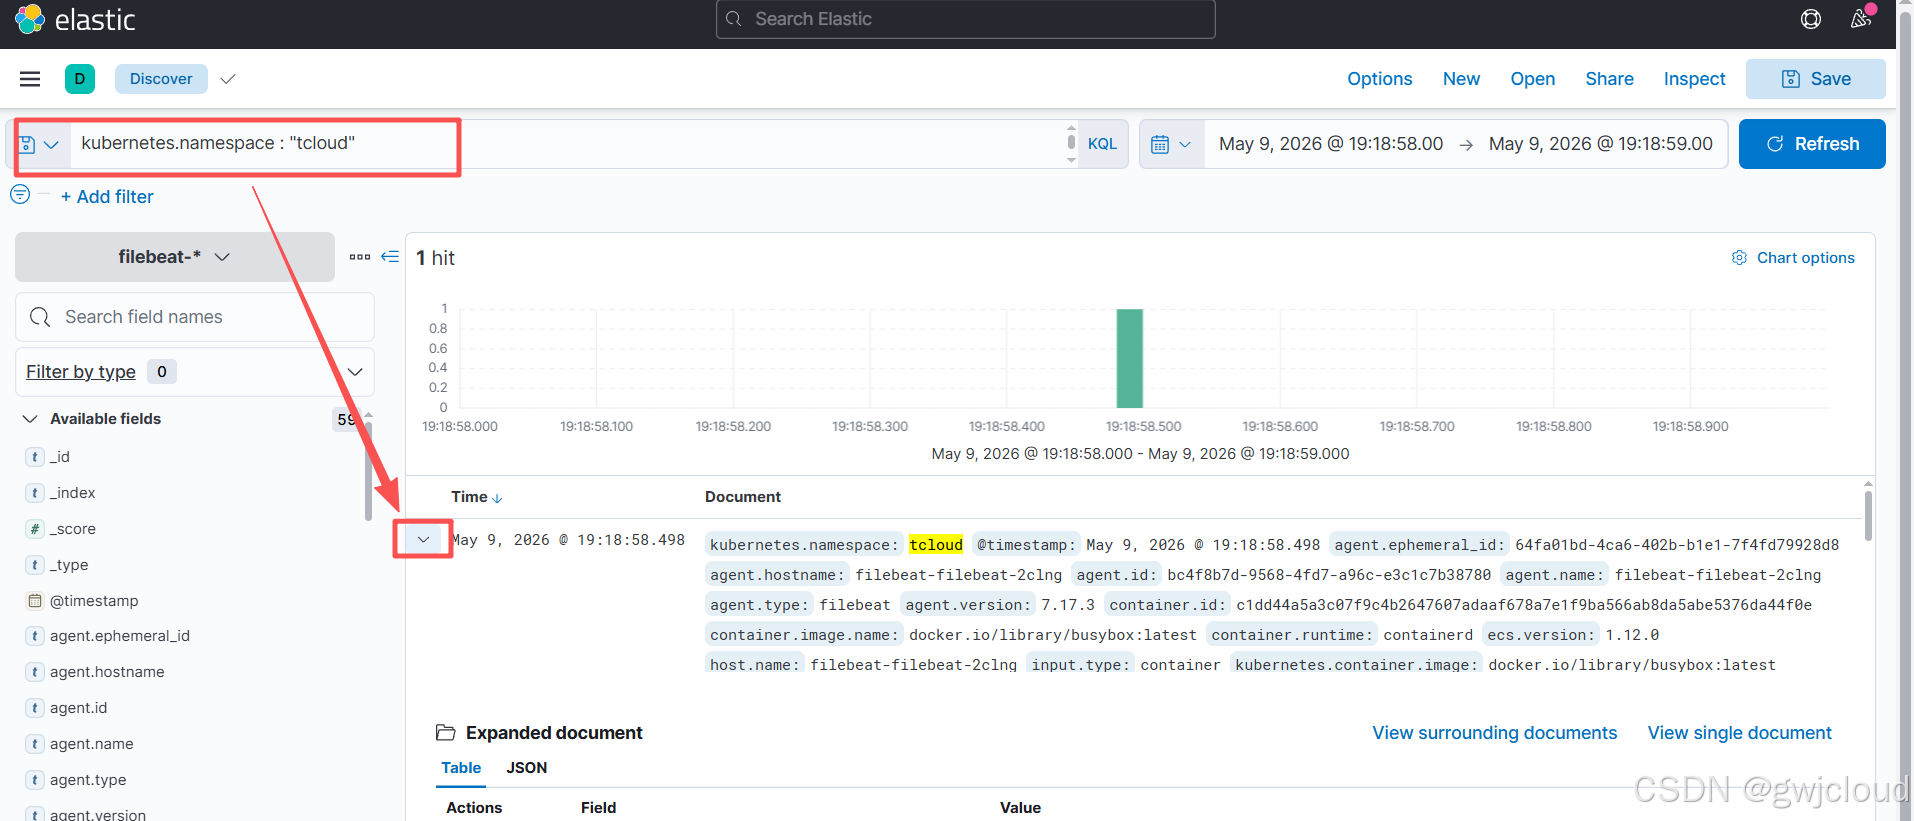
查看tcloud命名空间下的日志
常用Kibana KQL语法
按字段精确匹配
# 按命名空间筛选(你已经在用的)
kubernetes.namespace : "tcloud"

# 按 Pod 名筛选
kubernetes.pod.name : "test-logger"

# 按容器名筛选
kubernetes.container.name : "nginx"

# 按镜像名筛选
container.image.name : "busybox"
按关键词模糊匹配
# 日志内容包含 error(大小写不敏感)
message : "error"

# 日志内容包含多个关键词(AND 关系)
message : "error" AND message : "timeout"

# 日志内容包含 error 或 warn(OR 关系)
message : "error" OR message : "warn"

# 日志内容不包含某个词(NOT 关系)
kubernetes.namespace : "tcloud" AND NOT message : "health check"
# 清除环境
helm uninstall els -n logging
helm uninstall kibana -n logging
helm uninstall filebeat -n logging
kubectl delete namespace logging4、Loki
Loki简介
Loki 是 Grafana 官方推出的轻量级云原生日志系统,专为 Kubernetes 集群设计,采用 Loki + Promtail + Grafana 架构,替代传统笨重的 EFK 栈。
核心特点:只存日志索引标签、不全文分词,资源占用极低、部署简单、运维成本小。
核心工作原理
- Promtail 全局采集所有容器标准输出日志;
- 自动注入 K8s 标签:namespace、pod、container、node;
- Loki 只对标签建索引,日志原文压缩存储,不做全文分词;
- 查询时通过标签筛选,再拉取原文,速度快、省内存、省磁盘。
优势
- 资源极低:比 Elasticsearch 内存、磁盘占用少 70% 以上;
- 架构轻量:单节点即可生产可用,无需复杂集群调优;
- 天然适配 K8s:自动打标命名空间 / Pod / 容器,开箱即用;
- 自动生命周期:可配置日志保留 3 天 / 7 天 / 30 天,自动清理不炸盘;
- 运维简单:组件少、配置少、无海量索引碎片;
- 监控日志一体化:Grafana 同时看监控 + 日志,统一入口。
Loki部署
这里还是使用腾讯的TKE服务
| 节点名称(内网 IP) | 配置 | 组件 |
|---|---|---|
| 172.17.16.240 | SA9.LARGE84 核,8GB,5Mbps系统盘: 50GB 通用型 SSD 云硬盘 | K8s TKE 集群工作节点 |
| 172.17.17.123 | SA9.LARGE84 核,8GB,5Mbps系统盘: 50GB 通用型 SSD 云硬盘 | K8s TKE 集群工作节点 |
| 172.17.17.142 | SA9.LARGE84 核,8GB,5Mbps系统盘: 50GB 通用型 SSD 云硬盘 | K8s TKE 集群工作节点 |
# 添加helm仓库(如果添加不上是网络问题),可以找一台能添加上的把loki的压缩包(chart包)拉下来,上传到这里
[root@VM-16-240-tencentos ~]# helm repo add grafana https://grafana.github.io/helm-charts


# 更新仓库
[root@VM-16-240-tencentos ~]# helm repo update


# 查询可安装的版本
[root@VM-16-240-tencentos ~]# helm search repo grafana/loki -l
NAME                        	CHART VERSION	APP VERSION	DESCRIPTION
grafana/loki                	7.0.0        	3.6.7      	Helm chart for Grafana Loki and Grafana Enterpr...
grafana/loki                	6.55.0       	3.6.7      	Helm chart for Grafana Loki and Grafana Enterpr...
grafana/loki                	6.54.0       	3.6.7      	Helm chart for Grafana Loki and Grafana Enterpr...
grafana/loki                	6.53.0       	3.6.5      	Helm chart for Grafana Loki and Grafana Enterpr...
grafana/loki                	6.52.0       	3.6.4      	Helm chart for Grafana Loki and Grafana Enterpr...
grafana/loki                	6.51.0       	3.6.4      	Helm chart for Grafana Loki and Grafana Enterpr...
grafana/loki                	6.50.0       	3.6.3      	Helm chart for Grafana Loki and Grafana Enterpr...
grafana/loki                	6.49.0       	3.6.3      	Helm chart for Grafana Loki and Grafana Enterpr...
# 拉取
[root@VM-16-240-tencentos ~]# helm pull grafana/loki-stack --version 2.10.3
# 解压
[root@VM-16-240-tencentos ~]# tar -xf loki-stack-2.10.3.tgz
# 创建命名空间
[root@VM-16-240-tencentos ~]# kubectl create ns loki
# 安装
[root@VM-16-240-tencentos ~]# helm upgrade --install loki ./loki-stack --set grafana.enabled=true --set grafana.service.type=NodePort -n loki
# 查看pod
[root@VM-16-240-tencentos ~]# kubectl get pod -n loki
NAME READY STATUS RESTARTS AGE
loki-0 1/1 Running 0 75s
loki-grafana-6647dc47f6-zmhcr 2/2 Running 0 75s
loki-promtail-j69k5 1/1 Running 0 75s
loki-promtail-xzd92 1/1 Running 0 75s
loki-promtail-zgw4r 1/1 Running 0 75s
# 查看svc
[root@VM-16-240-tencentos ~]# kubectl get svc -n loki
NAME TYPE CLUSTER-IP EXTERNAL-IP PORT(S) AGE
loki ClusterIP 192.168.13.137 <none> 3100/TCP 104s
loki-grafana NodePort 192.168.52.210 <none> 80:32442/TCP 104s
loki-headless ClusterIP None <none> 3100/TCP 104s
loki-memberlist ClusterIP None <none> 7946/TCP 104s
# 获取Grafana管理员密码(base64解码)
[root@VM-16-240-tencentos ~]# kubectl get secret -n loki loki-grafana -o jsonpath="{.data.admin-password}" | base64 -d ; echo
sUfKValP9kn4C7nU1bfInR9CgbLEEFwbdSdan42i
Loki使用
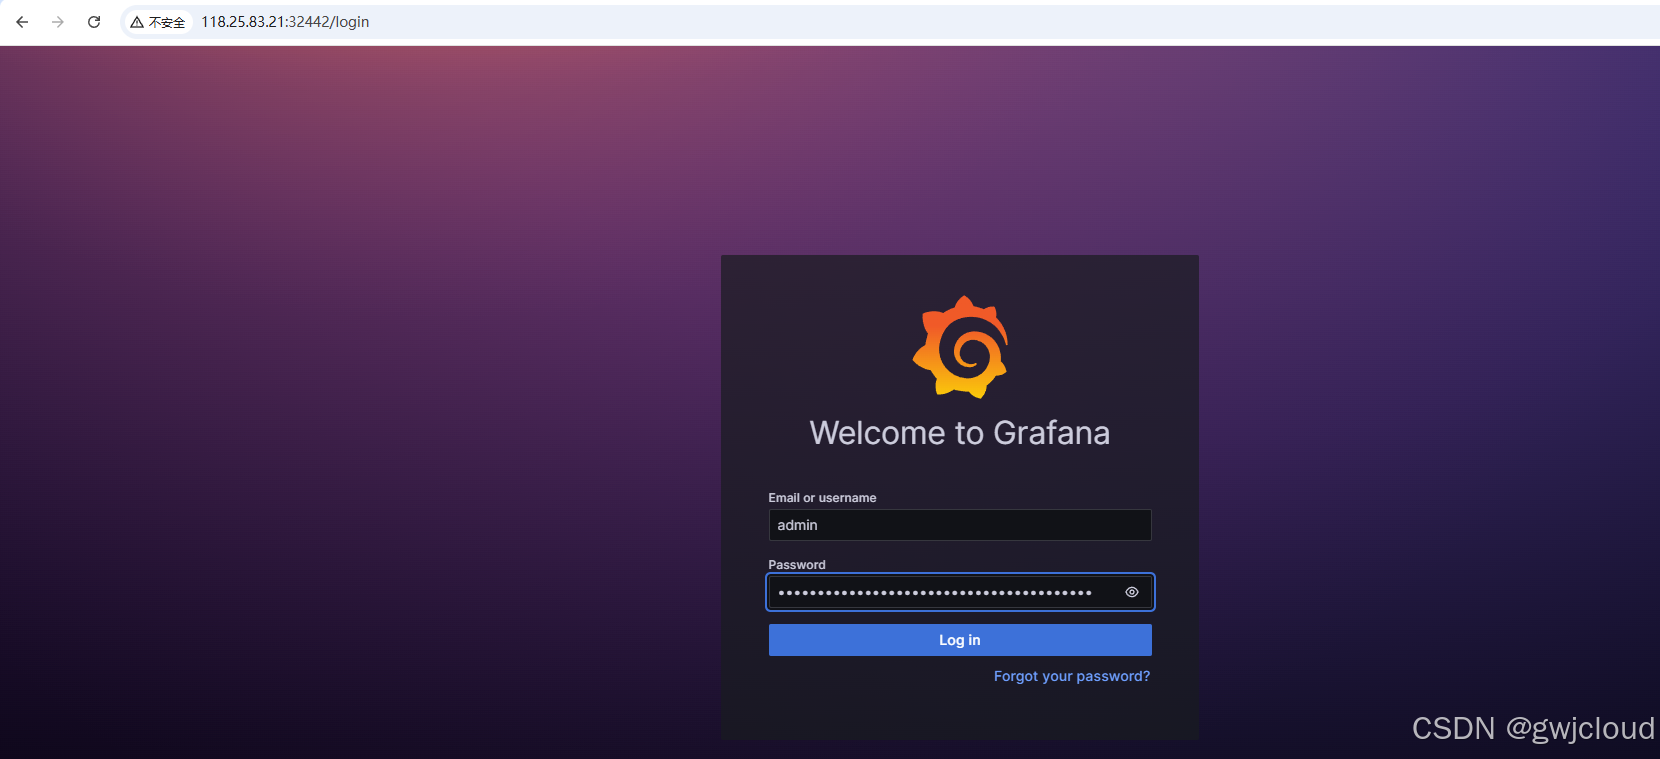
访问Grafana:节点IP + 端口(32442)
用账号admin和上述密码登录
 添加Loki数据源
如果有默认的就不需要添加了
没有添加方式:
在 Grafana 首页,点击左侧菜单的 Connections → Data sources
点击 Add data source,搜索并选择 Loki
在 URL 栏填写 Loki 的集群内地址:http://loki:3100
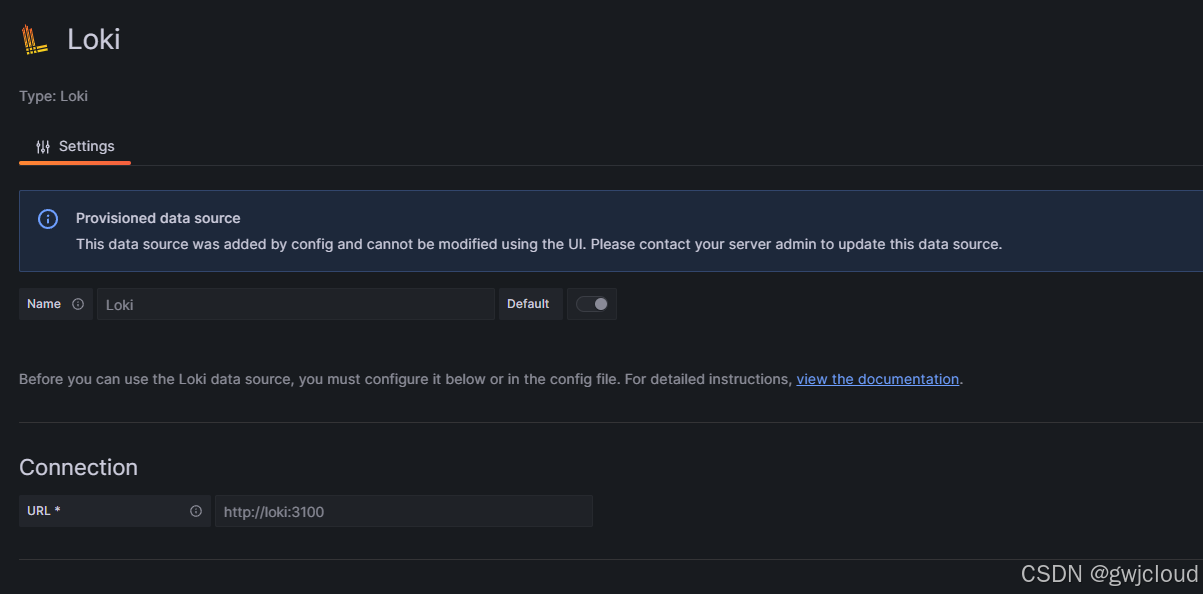
查看日志
# 创建一个测试pod
cat << EOF | kubectl apply -f -
apiVersion: apps/v1
kind: Deployment
metadata:
  name: nginx-loki
  labels:
    app: nginx
spec:
  replicas: 1
  selector:
    matchLabels:
      app: nginx
  template:
    metadata:
      labels:
        app: nginx
    spec:
      containers:
      - name: nginx
        image: nginx:latest
        ports:
        - containerPort: 80
---
apiVersion: v1
kind: Service
metadata:
  name: nginx-svc
spec:
  type: NodePort
  selector:
    app: nginx
  ports:
  - port: 80
    targetPort: 80
    nodePort: 30080
EOF

# 访问几次
[root@VM-16-240-tencentos ~]# curl 172.17.16.240:30080
查看日志
点击 “Explore”→选择 Loki 数据源→用标签查询日志
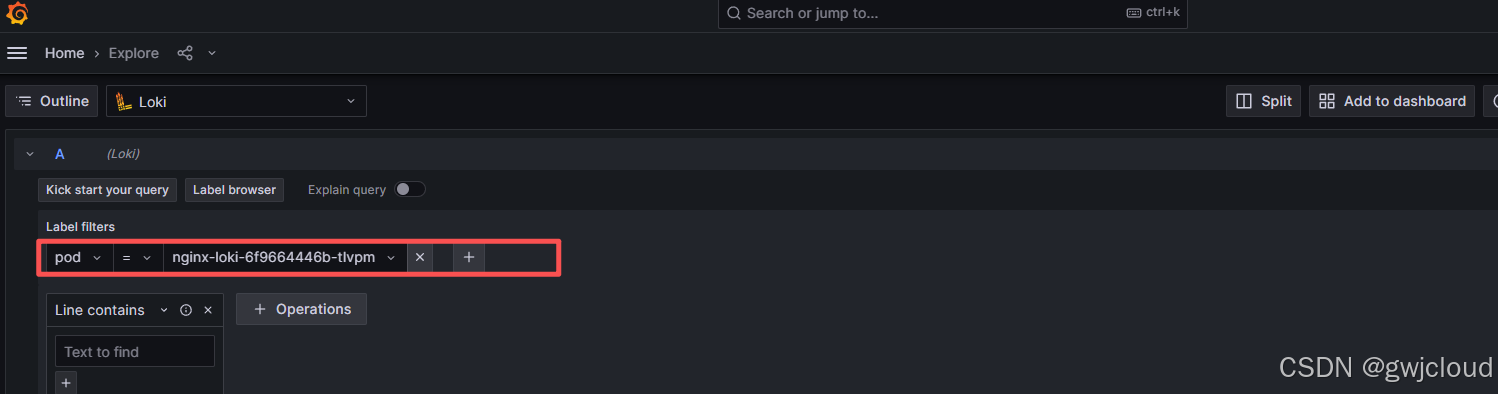
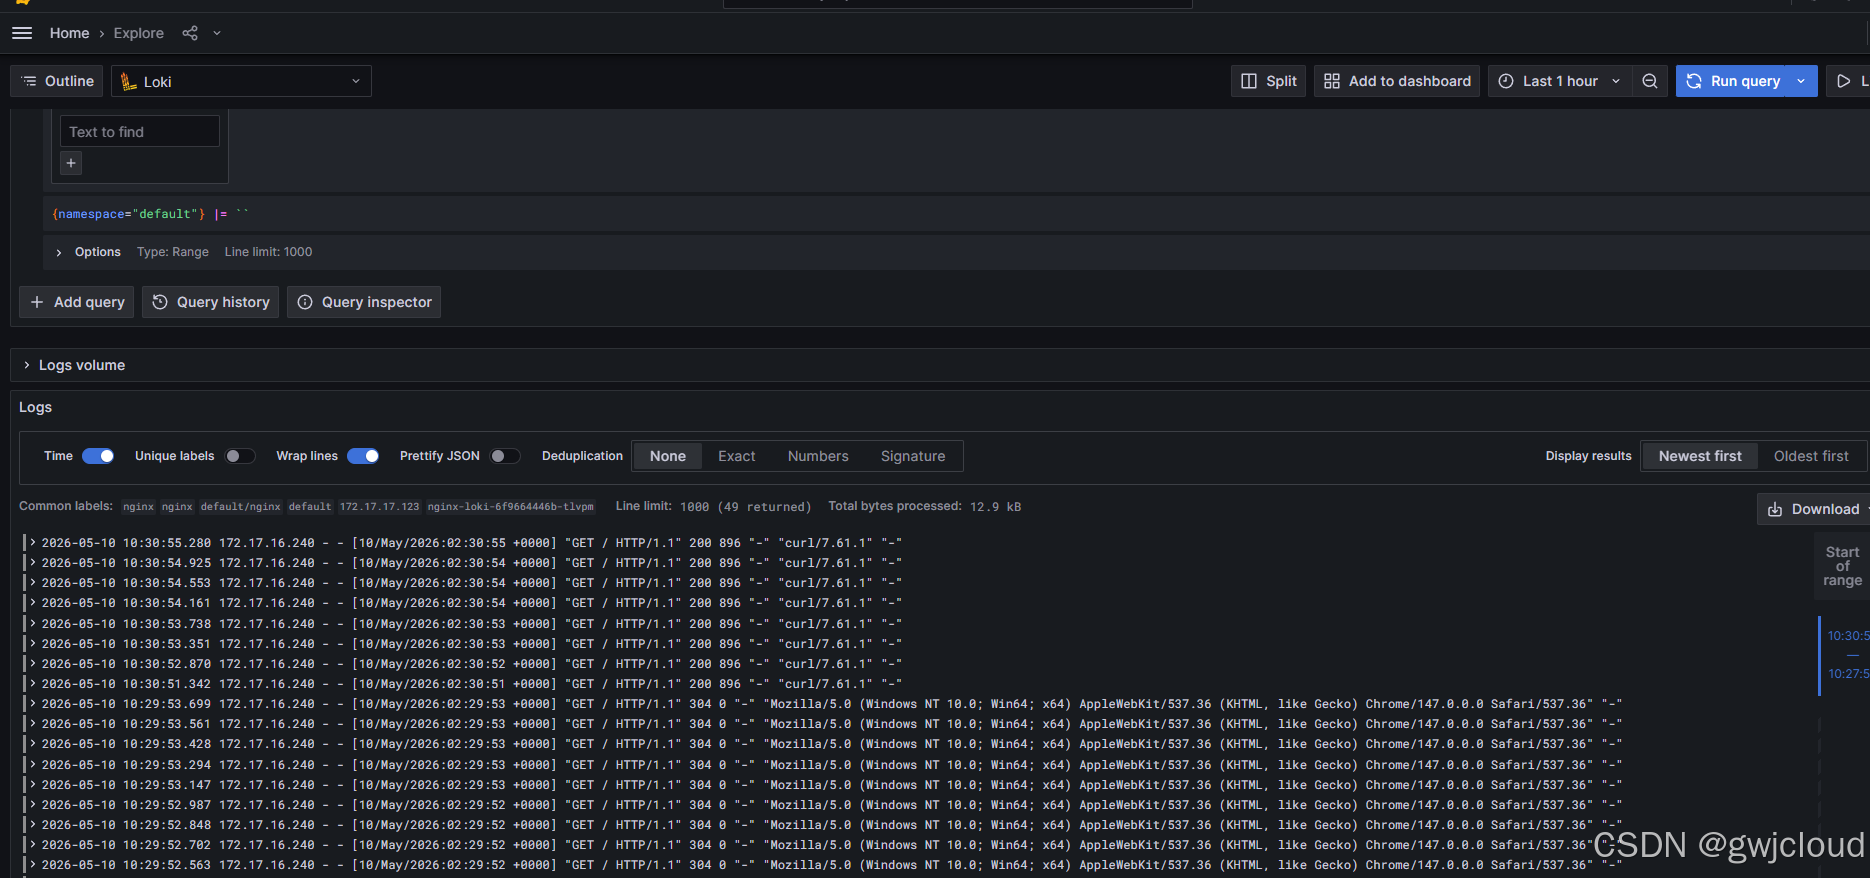
二、k8s监控-prometheus
在云原生、容器化、微服务全面普及的当下,传统监控工具(Zabbix、Nagios)在动态容器调度、微服务多维度指标、自动发现等场景下逐渐力不从心。
而 Prometheus 作为 CNCF 毕业顶级开源项目,凭借时序存储、灵活查询、原生适配 Kubernetes、生态丰富等优势,已成为云原生时代监控指标体系的事实标准。
1、什么是Prometheus
Prometheus 是一套开源时序数据库 + 监控采集 + 告警一体化系统,专注收集各类服务、服务器、容器的数值型监控指标(CPU、内存、磁盘、网络、接口 QPS、响应耗时、错误率等)。
核心定位
- 专注指标监控:存数字、画曲线、做告警、查趋势
- 适配物理机、虚拟机、Docker、K8s、微服务、中间件全场景
核心特点
- 时序数据存储:按「时间 + 标签」存储历史指标,方便回溯走势
- Pull 拉取模式:主动定时抓取目标指标,不用客户端上报
- 多维标签体系:支持集群、节点、Pod、服务多维度筛选聚合
- 原生 K8s 适配:自动发现 Node、Pod、Service,无需手动配置
- 内置 PromQL:强大查询语言,可聚合、过滤、计算监控数据
- 生态极其完善:各类 Exporter 全覆盖中间件、数据库、硬件
2、Prometheus整体架构
Prometheus 采用拉取(Pull)模式架构,整体工作流程:
- 各组件 / Exporter 暴露 HTTP 监控指标接口
- Prometheus Server 定时主动拉取指标数据
- 数据存入本地时序数据库
- 对外提供 PromQL 查询接口
- Grafana 拉取数据做可视化大屏
- 触发阈值告警后,推送告警到 Alertmanager
- Alertmanager 做去重、分组、静默,再推钉钉 / 企业微信 / 邮件
Exporter → Prometheus Server → 时序存储 → PromQL 查询 → Grafana 画图 → Alertmanager 告警
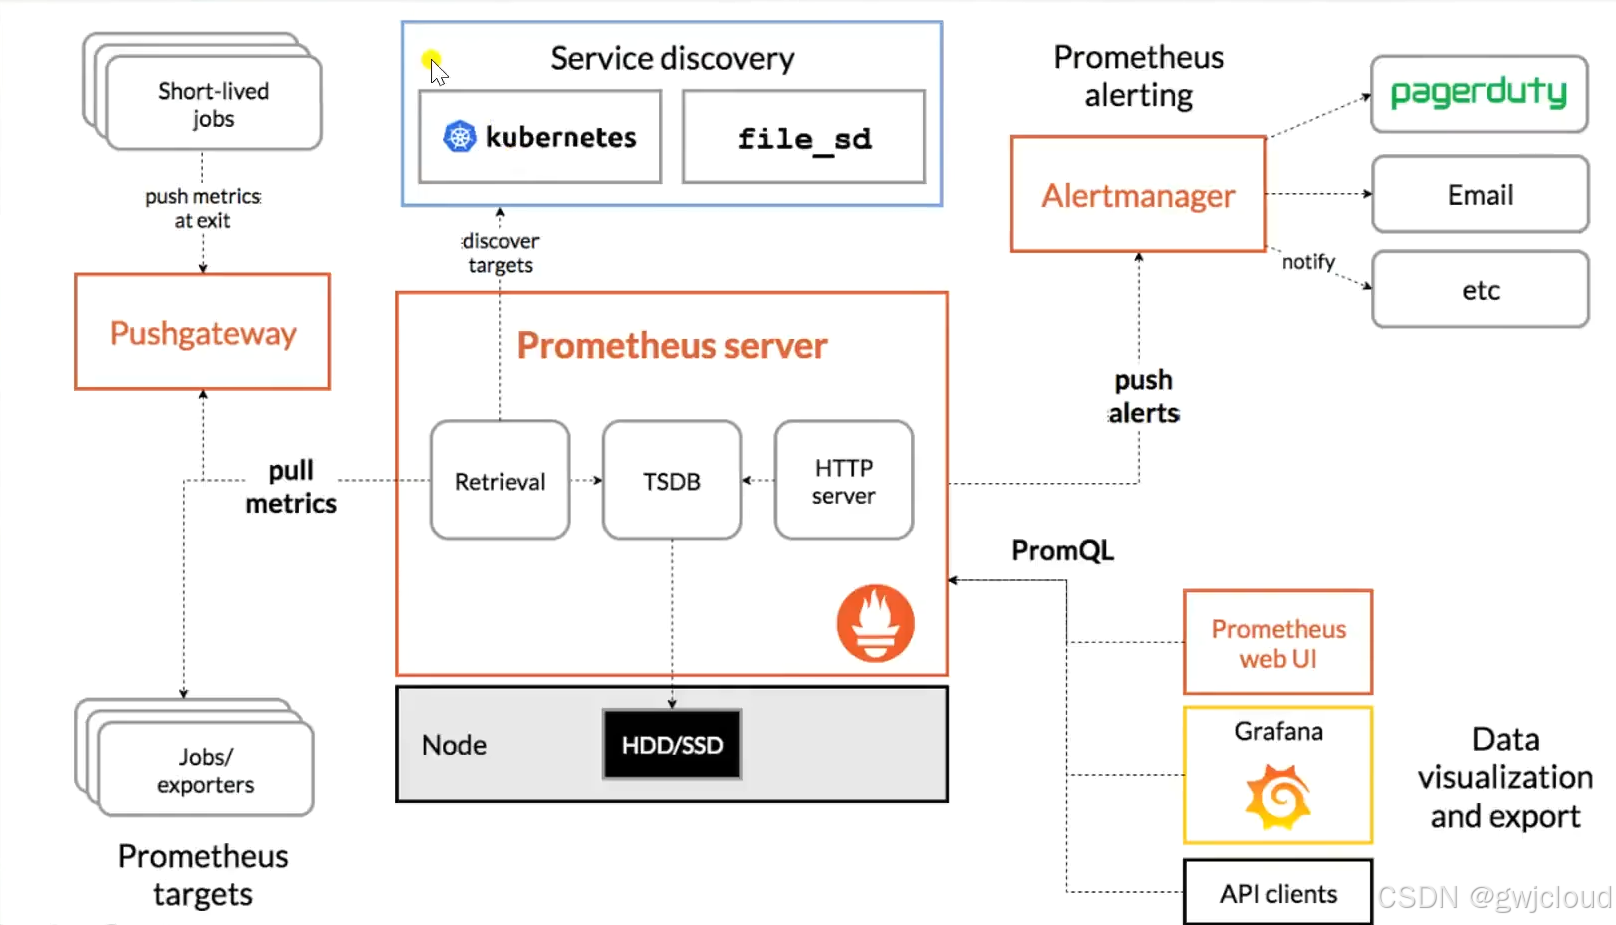
3、Prometheus核心组件
1、Prometheus Server(核心服务)整个监控体系的大脑,内置三大能力
- 定时抓取各Target监控指标
- 内置时序数据库,持久化时间序列数据
- 提供 PromQL 查询、告警规则评估
2、Exporter(指标采集器)各类被监控对象的指标翻译器,把服务器、中间件、业务程序的运行状态,转换成 Prometheus 能识别的标准 HTTP 指标格
- node-exporter:服务器 CPU、内存、磁盘、网络整机监控
- kube-state-metrics:K8s 集群节点、Pod、Deployment 资源状态监控
- mysql-exporter / redis-exporter:数据库、缓存中间件监控
- blackbox-exporter:网站、接口、端口连通性拨测监控
3、Alertmanager(告警管理器)独立于 Prometheus 的告警处理组件:
- 接收 Prometheus 发来的告警
- 做告警去重、分组、抑制、静默
- 统一推送:钉钉、企业微信、邮件、短信
4、Grafana(可视化看板)行业通用监控画图工具
- 对接 Prometheus 作为数据源
- 绘制折线图、饼图、仪表盘、拓扑大盘
- 海量现成监控模板,直接导入即用
5、Pushgateway(短任务指标网关)
适配一次性 / 定时短任务:比如
- 定时脚本、批处理任务,不能常驻被 Prometheus 拉取;
- 由任务主动推送指标到 Pushgateway,再由 Prometheus 拉取。
4、Prometheus关键核心概念
1)指标(Metric)
指标就是被监控对象的一项「数字状态」。
服务器、容器、数据库、程序每时每刻都在产生各种数值,能被 Prometheus 采集、记录、画图告警的数字项,就叫 Metric(指标)。
- 服务器 CPU 使用率:75% → 一个指标
- 内存已使用大小:8GB → 一个指标
- 接口每秒请求量 QPS:120 → 一个指标
- 程序错误请求总数:35 → 一个指标
- Redis 在线连接数:200 → 一个指标
指标(Metric)是 Prometheus 监控体系中最小监控单元,用于量化描述系统、服务、中间件在某一时刻的运行状态,以数值形式对外暴露,供采集、存储、查询、可视化与告警使用。
2)时间序列(Time Series)
同一个指标 + 同一组标签,随着时间不停记录的一串连续数据点,就是时间序列。
就像记录仪,每隔 15 秒记一次 CPU,连起来就是一条波动曲线。
3)标签(Label)
标签就是给指标打的多维分类备注,用来区分不同环境、节点、服务、Pod。
常见标签
- node="10.0.0.10" 节点
- pod="web-7f98765432" 容器
- env="prod" 生产环境
- service="order" 订单服务
可以按标签筛选、分组、聚合数据,比如只看生产环境某台节点的 CPU。
Label 是 Prometheus 实现多维度灵活查询的核心。
4)指标基础类型
1、Counter 计数器
特点:只增不减,只会越来越大,不会回落。
适用:请求总数、错误总数、重启次数、流量总上行。
2、Gauge 仪表盘
特点:可升可降,实时当前值。
适用:CPU 使用率、内存占用、在线人数、当前连接数。
3、Histogram 直方图
特点:统计数据分布区间,自动算耗时分位数。
适用:接口响应耗时、请求延迟分布。
4、Summary 摘要
特点:直接输出预设分位数,不用自己计算。
适用:业务接口耗时统计、延迟分析。
5)采集目标(Target)
凡是能暴露 /metrics 接口、被 Prometheus 拉取的对象,都叫一个 Target。
比如:每台服务器 node-exporter、每个 Pod 业务程序、MySQL exporter 都是一个 Target。
6)抓取规则(Scrape)
告诉 Prometheus:去哪抓、多久抓一次、抓哪个接口。
配置里写好地址和周期,Prometheus 就会自动定时拉取指标。
7)PromQL(查询语言)
Prometheus 专属查询语法,相当于监控界的 SQL。
可以筛选、过滤、计算、聚合、算增长率、求平均值、查峰值。
不用改配置,一条语句就能查出:
- 整机 CPU 最高的节点
- QPS 近 5 分钟增长率
- 内存占用前 10 的 Pod
8)数据持久化(TSDB时许数据库)
Prometheus 自带内置时序数据库,专门按时间存监控指标。
优化过时间序列存储,存得小、查得快、适合长期看趋势。
5、部署Prometheus
使用Kube-prometheus来部署
kube-prometheus 是官方打包好的、一键部署整套 K8s 监控告警全家桶的项目,不用你一个个装 Prometheus、Grafana、Alertmanager。
一套配齐,开箱即用:
- Prometheus:时序数据采集、指标存储、执行告警规则
- Alertmanager:告警分组、降噪、转发(发邮件 / 钉钉)
- Grafana:监控大盘图表
- kube-state-metrics:采集 K8s 资源状态(Pod / 节点 / 副本等指标)
- node-exporter:采集服务器 CPU / 内存 / 磁盘 / 网络
- 各类默认 PrometheusRule 告警规则(自带几十条生产告警)
查看集群版本
[root@k8s-master01 kube-prometheus]# kubectl get nodes
NAME           STATUS   ROLES    AGE   VERSION
k8s-master01   Ready    <none>   21d   v1.34.1
k8s-master02   Ready    <none>   21d   v1.34.1
k8s-master03   Ready    <none>   21d   v1.34.1
k8s-node01     Ready    <none>   21d   v1.34.1
k8s-node02     Ready    <none>   21d   v1.34.1
k8s-node03     Ready    <none>   21d   v1.34.1
拉取版本
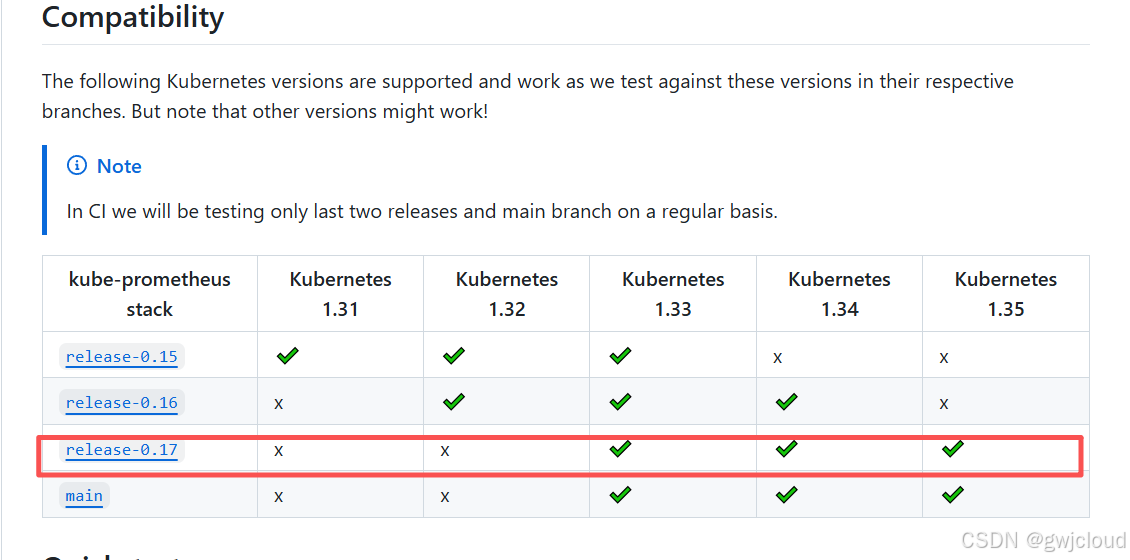
先查看集群版本适配的Prometheus的版本:https://github.com/prometheus-operator/kube-prometheus
# 拉取对应版本的相关文件
[root@k8s-master01 ~]# git clone -b release-0.17 https://github.com/prometheus-operator/kube-prometheus.git


# 查看说明文档
[root@k8s-master01 kube-prometheus]# cat README.md
...
* `--authentication-token-webhook=true` This flag enables, that a `ServiceAccount` token can be used to authenticate against the kubelet(s). This can also be enabled by setting the kubelet configuration value `authentication.webhook.enabled` to `true`.
* `--authorization-mode=Webhook` This flag enables, that the kubelet will perform an RBAC request with the API to determine, whether the requesting entity (Prometheus in this case) is allowed to access a resource, in specific for this project the `/metrics` endpoint. This can also be enabled by setting the kubelet configuration value `authorization.mode` to `Webhook`.
...
--authentication-token-webhook=true允许使用 ServiceAccount 令牌对 kubelet 进行认证,让 Prometheus 安全访问指标。
--authorization-mode=Webhook开启 Webhook 授权模式,kubelet 会通过 API Server 做 RBAC 权限判断,确保只有合法的 Prometheus 才能读取 /metrics。


# 查询集群的kubelet是否开启
[root@k8s-master01 kube-prometheus]# grep -A10 -B5 -E "authentication|authorization" /etc/kubernetes/kubelet-conf.yml
kind: KubeletConfiguration
address: 0.0.0.0
port: 10250
readOnlyPort: 10255
podSandboxImage: registry.k8s.io/pause:3.10.1
authentication:
  anonymous:
    enabled: false
  webhook:
    cacheTTL: 2m0s
    enabled: true
  x509:
    clientCAFile: /etc/kubernetes/pki/ca.pem
authorization:
  mode: Webhook
  webhook:
    cacheAuthorizedTTL: 5m0s
    cacheUnauthorizedTTL: 30s
cgroupDriver: systemd
cgroupsPerQOS: true
clusterDNS:
- 10.96.0.10
clusterDomain: cluster.local
containerLogMaxFiles: 5

可以看到已经开启,可以使用
查询使用镜像并替换
# 查询部署Prometheus需要的镜像
[root@k8s-master01 kube-prometheus]# find manifests -name "*.yaml" -type f | grep -v setup | while read file; do
  images=$(grep -E '^[ ]+image:' "$file" | awk '{print $2}' | sort -u)
  if [ -n "$images" ]; then
    echo "文件: $file"
    echo "$images" | while read img; do
      echo "镜像: $img"
    done
    echo ""
  fi
done

文件: manifests/alertmanager-alertmanager.yaml
镜像: quay.io/prometheus/alertmanager:v0.31.1

文件: manifests/blackboxExporter-deployment.yaml
镜像: ghcr.io/jimmidyson/configmap-reload:v0.15.0
镜像: quay.io/brancz/kube-rbac-proxy:v0.21.0
镜像: quay.io/prometheus/blackbox-exporter:v0.28.0

文件: manifests/grafana-deployment.yaml
镜像: grafana/grafana:12.4.1

文件: manifests/kubeStateMetrics-deployment.yaml
镜像: quay.io/brancz/kube-rbac-proxy:v0.21.0
镜像: registry.k8s.io/kube-state-metrics/kube-state-metrics:v2.18.0

文件: manifests/nodeExporter-daemonset.yaml
镜像: quay.io/brancz/kube-rbac-proxy:v0.21.0
镜像: quay.io/prometheus/node-exporter:v1.10.2

文件: manifests/prometheus-prometheus.yaml
镜像: quay.io/prometheus/prometheus:v3.10.0

文件: manifests/prometheusAdapter-deployment.yaml
镜像: registry.k8s.io/prometheus-adapter/prometheus-adapter:v0.12.0

文件: manifests/prometheusOperator-deployment.yaml
镜像: quay.io/brancz/kube-rbac-proxy:v0.21.0
镜像: quay.io/prometheus-operator/prometheus-operator:v0.89.0
这里我们拉取不到的镜像有:
grafana/grafana:12.4.1
registry.k8s.io/kube-state-metrics/kube-state-metrics:v2.18.0
registry.k8s.io/prometheus-adapter/prometheus-adapter:v0.12.0
使用DaoCloud增加/替换前缀的方法
# 修改镜像 (注意对应版本)
# 替换 grafana
[root@k8s-master01 kube-prometheus]# sed -i 's|grafana/grafana:12.4.1|docker.m.daocloud.io/grafana/grafana:12.4.1|g' manifests/grafana-deployment.yaml

# 替换 kube-state-metrics
[root@k8s-master01 kube-prometheus]# sed -i 's|registry.k8s.io/kube-state-metrics/kube-state-metrics:v2.18.0|k8s.m.daocloud.io/kube-state-metrics/kube-state-metrics:v2.18.0|g' manifests/kubeStateMetrics-deployment.yaml

# 替换 prometheus-adapter
[root@k8s-master01 kube-prometheus]# sed -i 's|registry.k8s.io/prometheus-adapter/prometheus-adapter:v0.12.0|k8s.m.daocloud.io/prometheus-adapter/prometheus-adapter:v0.12.0|g' manifests/prometheusAdapter-deployment.yaml
# 安装CRD(自定义资源) + monitoring 命名空间
[root@k8s-master01 kube-prometheus]# cd manifests/
[root@k8s-master01 manifests]# kubectl create -f setup/


# 执行命令等待CRD完全就绪
# Established:CRD 已注册生效、集群已识别
# condition met:条件满足 = 已经就绪
[root@k8s-master01 manifests]# kubectl wait --for=condition=Established --all CustomResourceDefinition --namespace=monitoring
customresourcedefinition.apiextensions.k8s.io/alertmanagerconfigs.monitoring.coreos.com condition met
customresourcedefinition.apiextensions.k8s.io/alertmanagers.monitoring.coreos.com condition met
customresourcedefinition.apiextensions.k8s.io/podmonitors.monitoring.coreos.com condition met
customresourcedefinition.apiextensions.k8s.io/probes.monitoring.coreos.com condition met
customresourcedefinition.apiextensions.k8s.io/prometheusagents.monitoring.coreos.com condition met
customresourcedefinition.apiextensions.k8s.io/prometheuses.monitoring.coreos.com condition met
customresourcedefinition.apiextensions.k8s.io/prometheusrules.monitoring.coreos.com condition met
customresourcedefinition.apiextensions.k8s.io/scrapeconfigs.monitoring.coreos.com condition met
customresourcedefinition.apiextensions.k8s.io/servicemonitors.monitoring.coreos.com condition met
customresourcedefinition.apiextensions.k8s.io/thanosrulers.monitoring.coreos.com condition met
# 创建Prometheus所有组件
[root@k8s-master01 manifests]# kubectl apply -f .
...


# 等待所有组件running
[root@k8s-master01 manifests]# kubectl get pod -n monitoring
NAME                                   READY   STATUS    RESTARTS   AGE
alertmanager-main-0                    2/2     Running   0          3m19s
alertmanager-main-1                    2/2     Running   0          3m19s
alertmanager-main-2                    2/2     Running   0          3m19s
blackbox-exporter-7fbddb9bfd-4xr7r     3/3     Running   0          5m28s
grafana-9cc954875-jknrk                1/1     Running   0          5m27s
kube-state-metrics-7f8cfc5685-r2ffd    3/3     Running   0          5m27s
node-exporter-4tzgk                    2/2     Running   0          5m26s
node-exporter-5fbzk                    2/2     Running   0          5m26s
node-exporter-5wsf4                    2/2     Running   0          5m26s
node-exporter-dzvwq                    2/2     Running   0          5m26s
node-exporter-h8wth                    2/2     Running   0          5m26s
node-exporter-jb4rk                    2/2     Running   0          5m26s
prometheus-adapter-bd8f8cd5d-g42jh     1/1     Running   0          5m25s
prometheus-adapter-bd8f8cd5d-rcqq2     1/1     Running   0          5m25s
prometheus-k8s-0                       2/2     Running   0          3m19s
prometheus-k8s-1                       2/2     Running   0          3m19s
prometheus-operator-84677856f9-f8cvf   2/2     Running   0          5m25s
# 组件说明
1. prometheus-operator-xxx
角色:整个监控集群的大管家 / 控制器
自动管理 Prometheus、Alertmanager 生命周期
自动监听 ServiceMonitor/PodMonitor 自动添加监控采集规则
自动热更新配置、证书、RBAC 权限
不用你手动改配置,全由它自动化管理


2. prometheus-k8s-0 / prometheus-k8s-1
角色:监控核心 + 数据库
采集全集群:节点、Pod、容器、中间件的监控指标
存储时序监控数据
执行告警规则、生成告警
双副本高可用,挂一个不影响监控

3. alertmanager-main-0/1/2
角色:告警分发中心
接收 Prometheus 发出来的告警
做告警分组、降噪、静默、路由
转发到:钉钉、企业微信、邮件、短信
3 副本集群,保证告警不丢失

4. grafana-xxx
角色:可视化大盘看板
把 Prometheus 枯燥数据变成图形、仪表盘
自带 k8s 集群 CPU / 内存 / 磁盘 / 网络现成模板
日常看监控、看集群状态全靠它

5. node-exporter-xxx (一堆)
角色:每台服务器硬件监控采集器DaemonSet 部署,每个节点自动跑一个
采集主机:CPU、内存、磁盘 IO、磁盘使用率、网卡流量、系统负载
服务器层面所有监控都靠它上报

6. kube-state-metrics-xxx
角色:K8s 集群资源状态采集专门抓 K8s 内部资源状态:
Pod 重启次数、副本状态、是否就绪
Deployment/StatefulSet 副本数、就绪数
Node 状态、资源配额
不监控硬件,只监控 k8s 资源对象状态

7. blackbox-exporter-xxx
角色:黑盒探测监控用来主动探测:
HTTP/HTTPS 接口通不通、响应码
TCP 端口是否存活
DNS 解析、ICMP 网络连通性
适合监控业务接口、端口、外网域名可用性

8. prometheus-adapter-xxx 双副本
角色:K8s HPA 自定义指标适配器
把 Prometheus 监控指标转换成 K8s 认可的自定义指标
给 HPA 自动扩缩容 用:比如根据 QPS、CPU 负载自动增减 Pod 数量
修改Grafana的service类型
使用kube-prometheus 装完自动自带严格 NetworkPolicy,直接把 monitoring 命名空间外网 / 跨命名空间访问全封死了。
[root@k8s-master01 ~]# kubectl get netpol -n monitoring
NAME                  POD-SELECTOR                                                                                                                                             AGE
alertmanager-main     app.kubernetes.io/component=alert-router,app.kubernetes.io/instance=main,app.kubernetes.io/name=alertmanager,app.kubernetes.io/part-of=kube-prometheus   73m
blackbox-exporter     app.kubernetes.io/component=exporter,app.kubernetes.io/name=blackbox-exporter,app.kubernetes.io/part-of=kube-prometheus                                  73m
grafana               app.kubernetes.io/component=grafana,app.kubernetes.io/name=grafana,app.kubernetes.io/part-of=kube-prometheus                                             73m
kube-state-metrics    app.kubernetes.io/component=exporter,app.kubernetes.io/name=kube-state-metrics,app.kubernetes.io/part-of=kube-prometheus                                 73m
node-exporter         app.kubernetes.io/component=exporter,app.kubernetes.io/name=node-exporter,app.kubernetes.io/part-of=kube-prometheus                                      73m
prometheus-adapter    app.kubernetes.io/component=metrics-adapter,app.kubernetes.io/name=prometheus-adapter,app.kubernetes.io/part-of=kube-prometheus                          73m
prometheus-k8s        app.kubernetes.io/component=prometheus,app.kubernetes.io/instance=k8s,app.kubernetes.io/name=prometheus,app.kubernetes.io/part-of=kube-prometheus        73m
prometheus-operator   app.kubernetes.io/component=controller,app.kubernetes.io/name=prometheus-operator,app.kubernetes.io/part-of=kube-prometheus                              73m

# 说明
默认拒绝所有外部访问
只允许监控组件自己内部通信
# 删除所有networkpolicy
[root@k8s-master01 ~]# kubectl delete networkpolicy -n monitoring --all
# 修改Grafana的service为NodePort
[root@k8s-master01 ~]# kubectl edit svc -n monitoring grafana
把ClusterIP 改为NodePort

# 查看Grafana的svc的端口
[root@k8s-master01 ~]# kubectl get svc -n monitoring
NAME                    TYPE        CLUSTER-IP      EXTERNAL-IP   PORT(S)                      AGE
alertmanager-main       ClusterIP   10.96.165.80    <none>        9093/TCP,8080/TCP            5m43s
alertmanager-operated   ClusterIP   None            <none>        9093/TCP,9094/TCP,9094/UDP   5m32s
blackbox-exporter       ClusterIP   10.96.239.192   <none>        9115/TCP,19115/TCP           5m43s
grafana                 NodePort    10.96.202.109   <none>        3000:32614/TCP               5m41s
kube-state-metrics      ClusterIP   None            <none>        8443/TCP,9443/TCP            5m41s
node-exporter           ClusterIP   None            <none>        9100/TCP                     5m40s
prometheus-adapter      ClusterIP   10.96.62.105    <none>        443/TCP                      5m38s
prometheus-k8s          ClusterIP   10.96.147.12    <none>        9090/TCP,8080/TCP            5m39s
prometheus-operated     ClusterIP   None            <none>        9090/TCP                     5m31s
prometheus-operator     ClusterIP   None            <none>        8443/TCP                     5m38s
还要修改以下Grafana的就绪探针(readinessProbe),默认一启动立刻开始检查,导致有可能误判从而杀掉Granfana(集群配置高不用修改)
[root@k8s-master01 ~]# kubectl edit deployment grafana -n monitoring
找到 readinessProbe 这一段
readinessProbe:
  initialDelaySeconds: 90    # 这一行【新增】
  failureThreshold: 30       # 这一行【修改】
  httpGet:
    path: /api/health
    port: http
    scheme: HTTP
  periodSeconds: 10
  successThreshold: 1
  timeoutSeconds: 5          # 这一行【修改】
说明:
加了 initialDelaySeconds: 90 → 给 Grafana 90 秒的启动缓冲期
failureThreshold 从 3 改到 30 → 允许失败 30 次,给足启动时间
timeoutSeconds 从 1 改到 5 → 每次检查超时时间更宽松
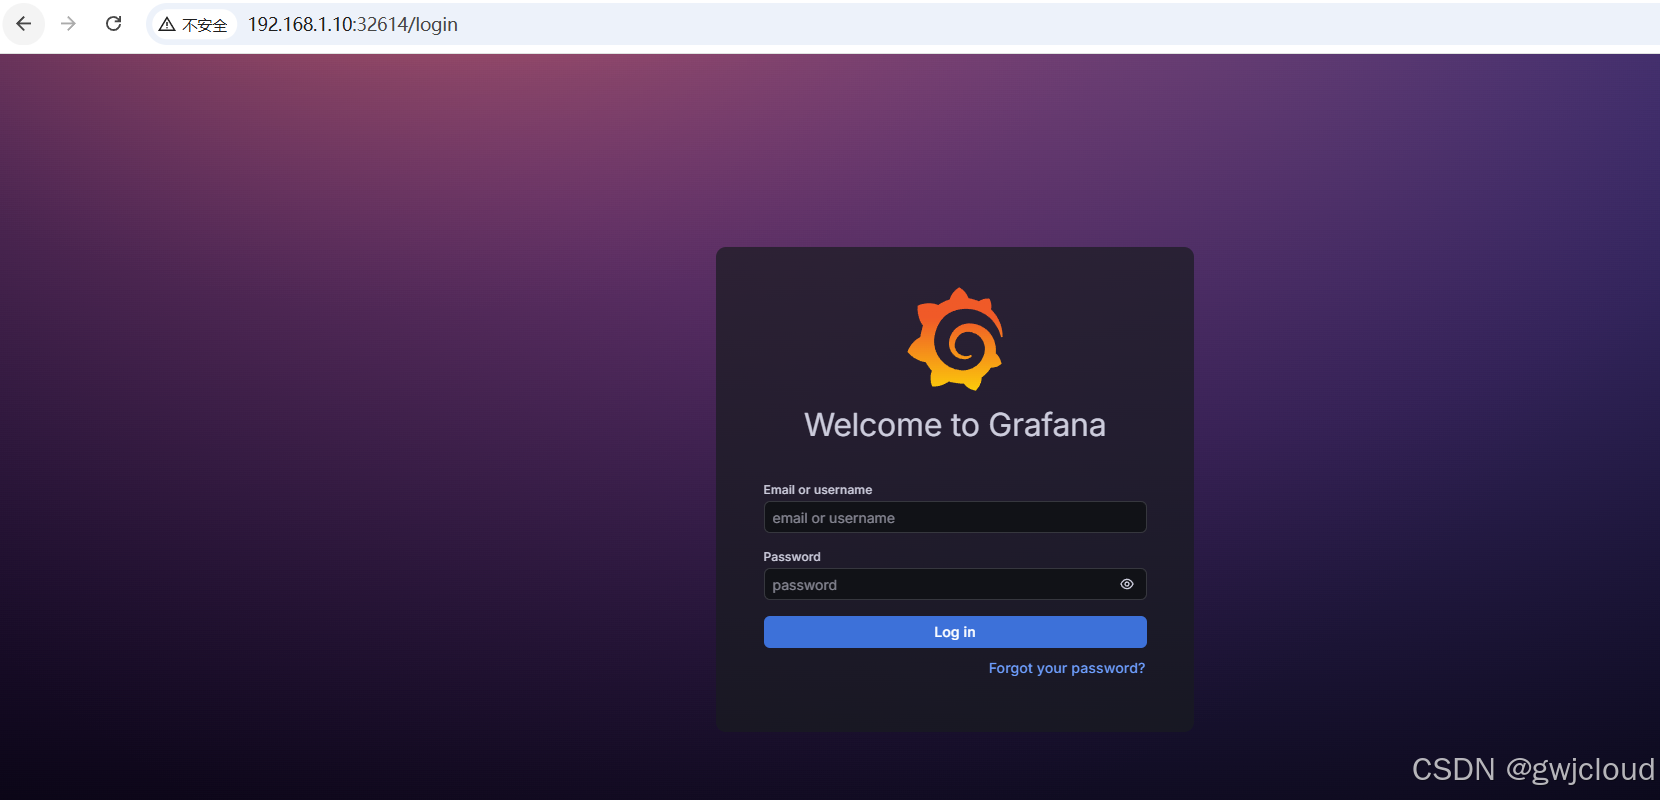
访问Grafana
访问Grafana,登录成功要修改密码
账号:admin
密码:admin
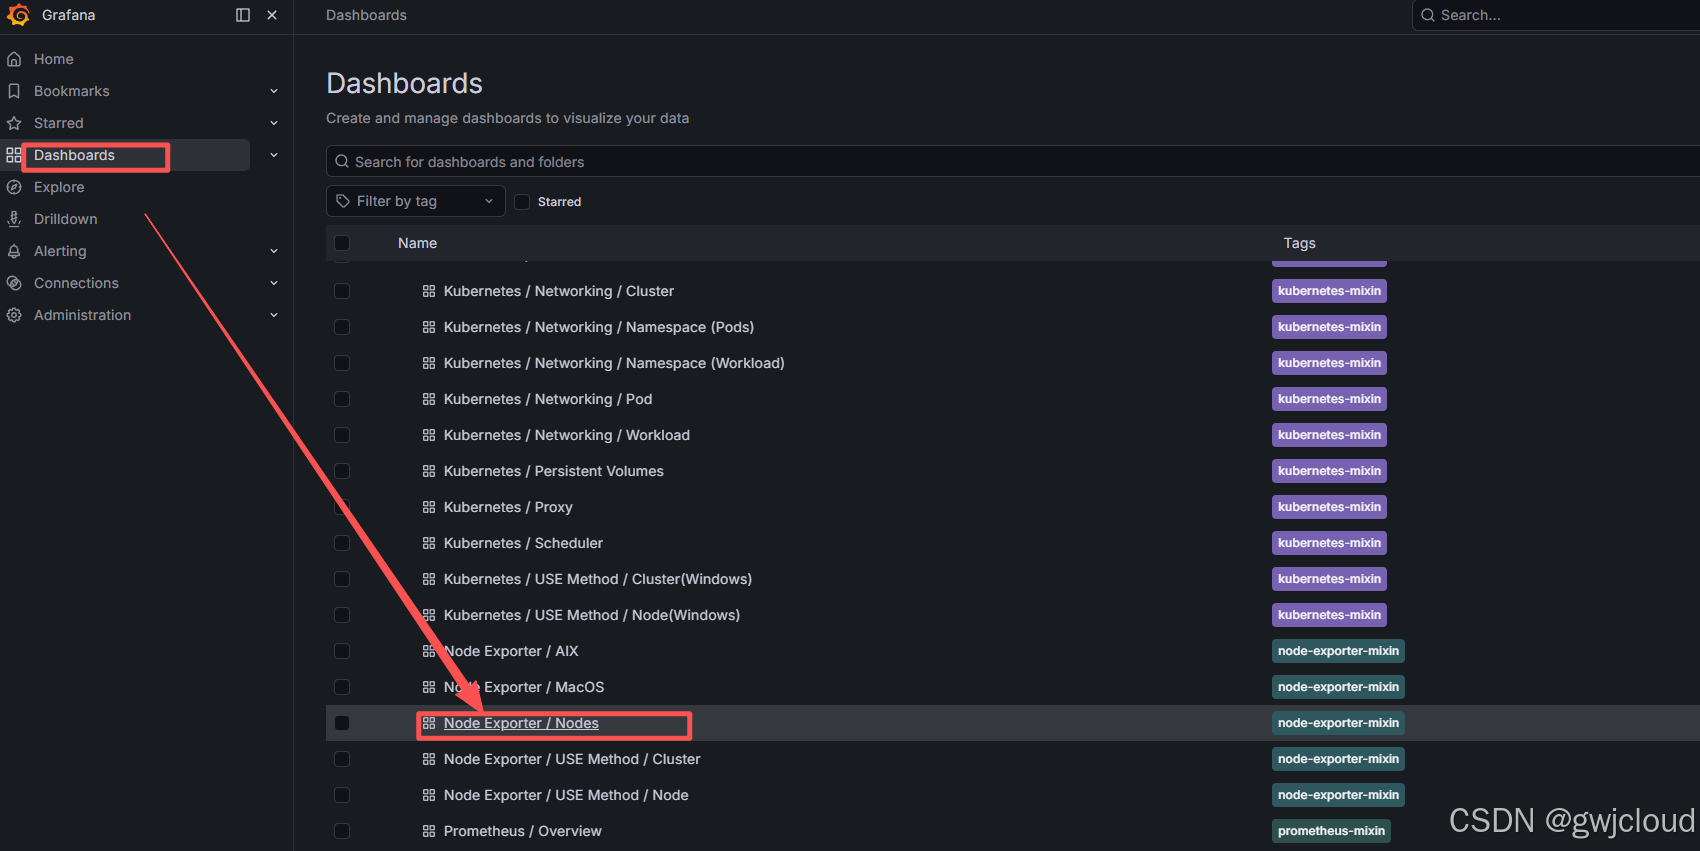
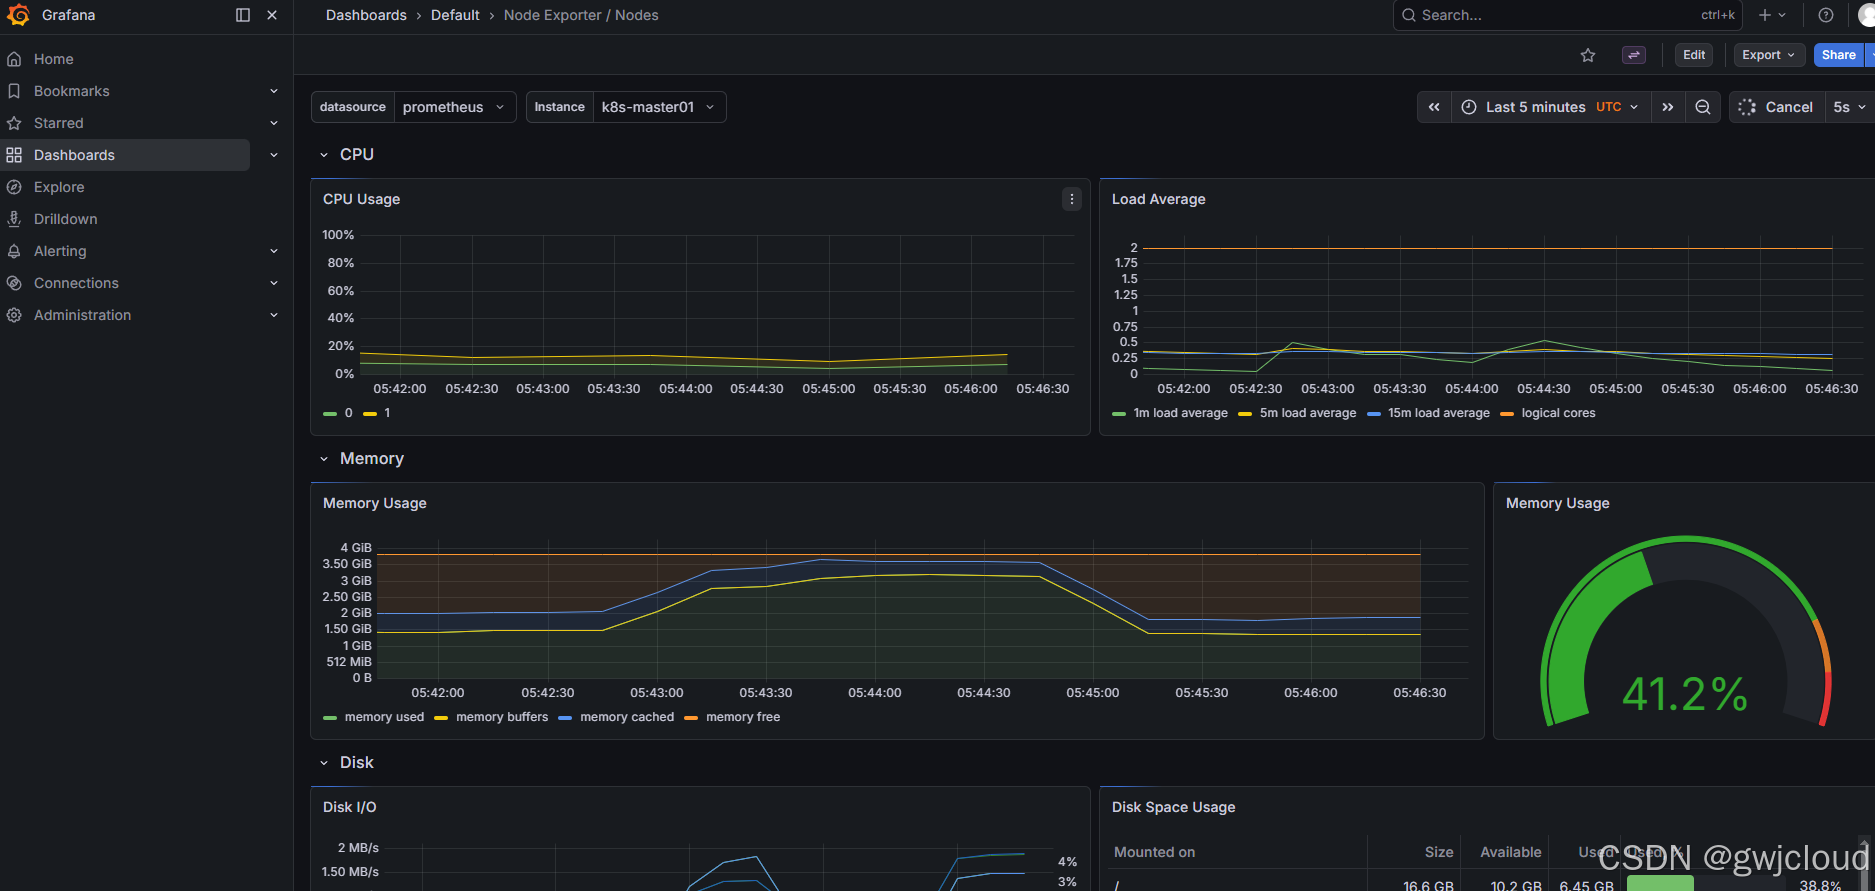
查看节点的监控
Dashboards——Node Exporter / Nodes
查看node上pod数据
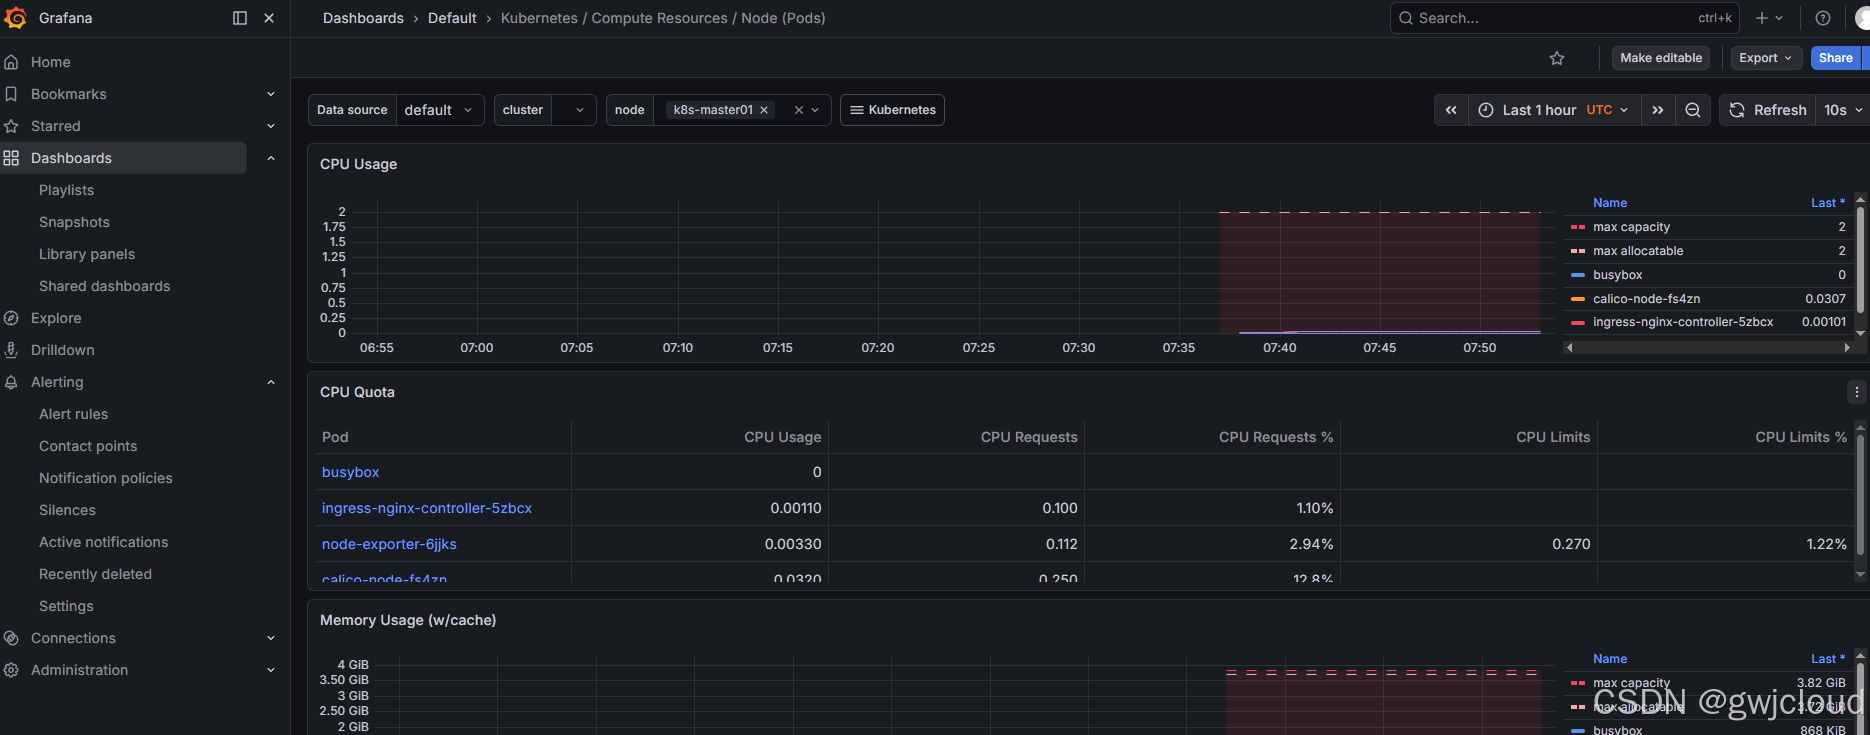
DashboardsDefaultKubernetes / Compute Resources / Node (Pods)
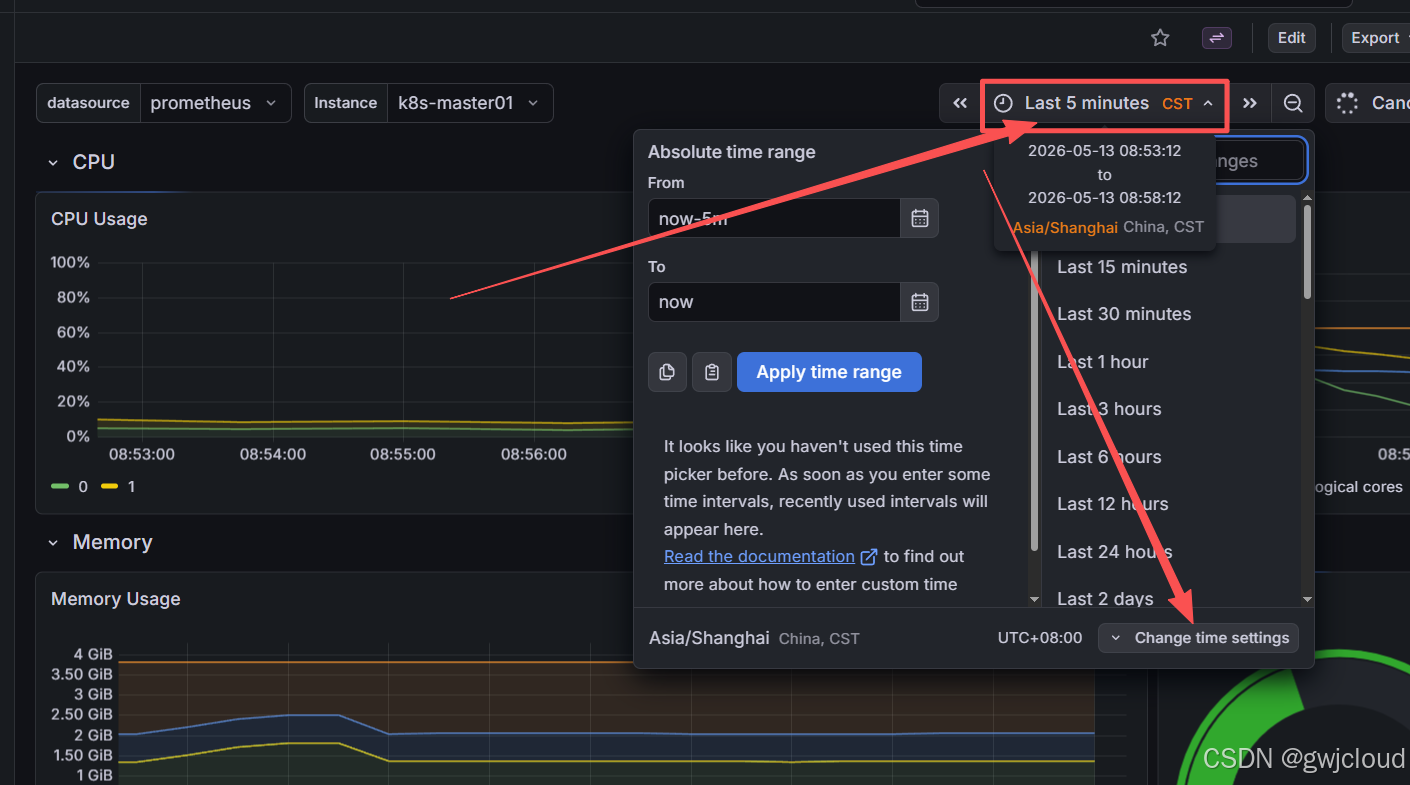
更改Grafana时区
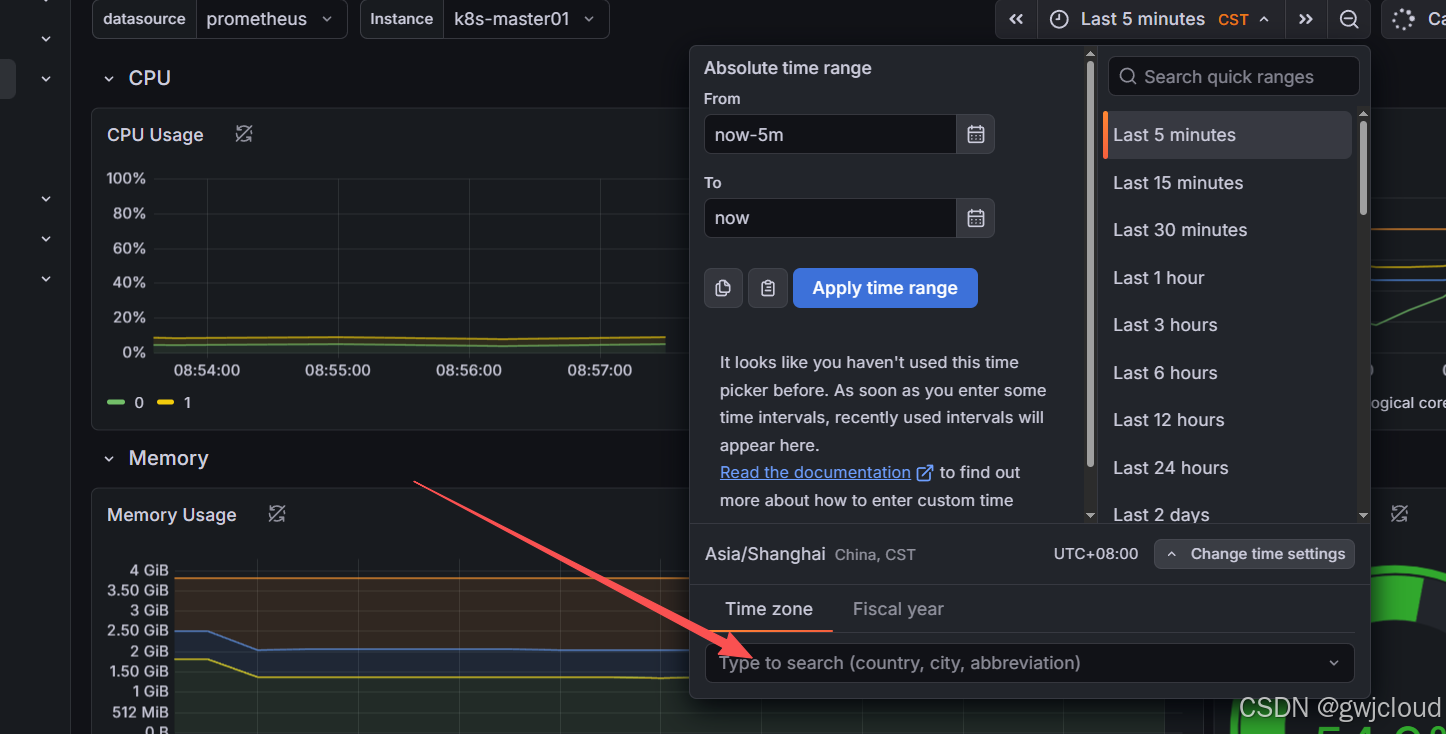
搜索Asia/Shanghai,选中即可。
添加Grafana官方监控模板
可以从Grafana官方下载监控模板地址:https://grafana.com/grafana/dashboards/
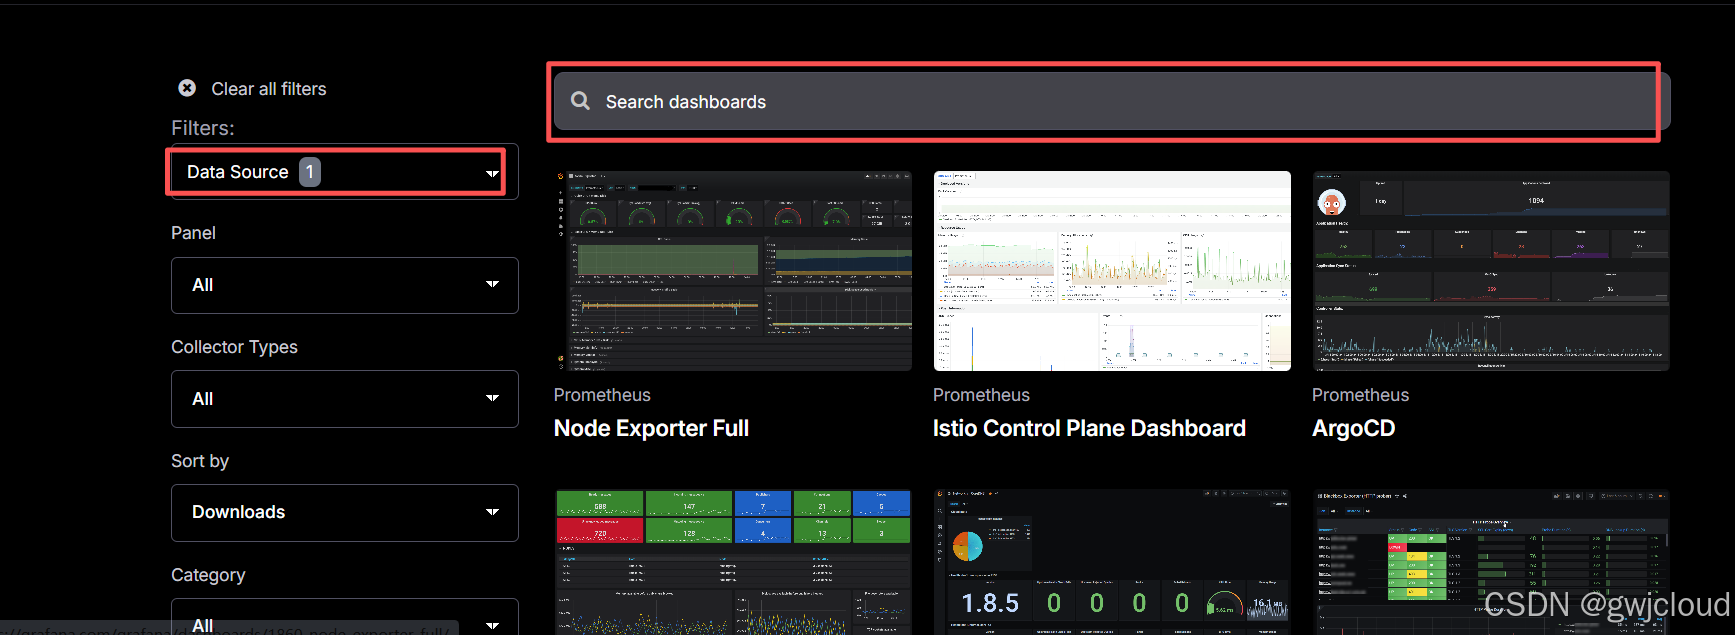
可以从左边Filters:Data Source的地址下拉找到数据来源,选择Prometheus的模板,就会出现一下可以用于Prometheus的监控模板
也可以从Search dashboards地址搜索关键词:
1、Node Exporter(主机 CPU / 内存 / 磁盘 / 网络监控)
2、Kubernetes Cluster(整个集群的大盘)
3、Kubernetes Pods(按 Pod 维度的监控) 等等
选择模板进行导入
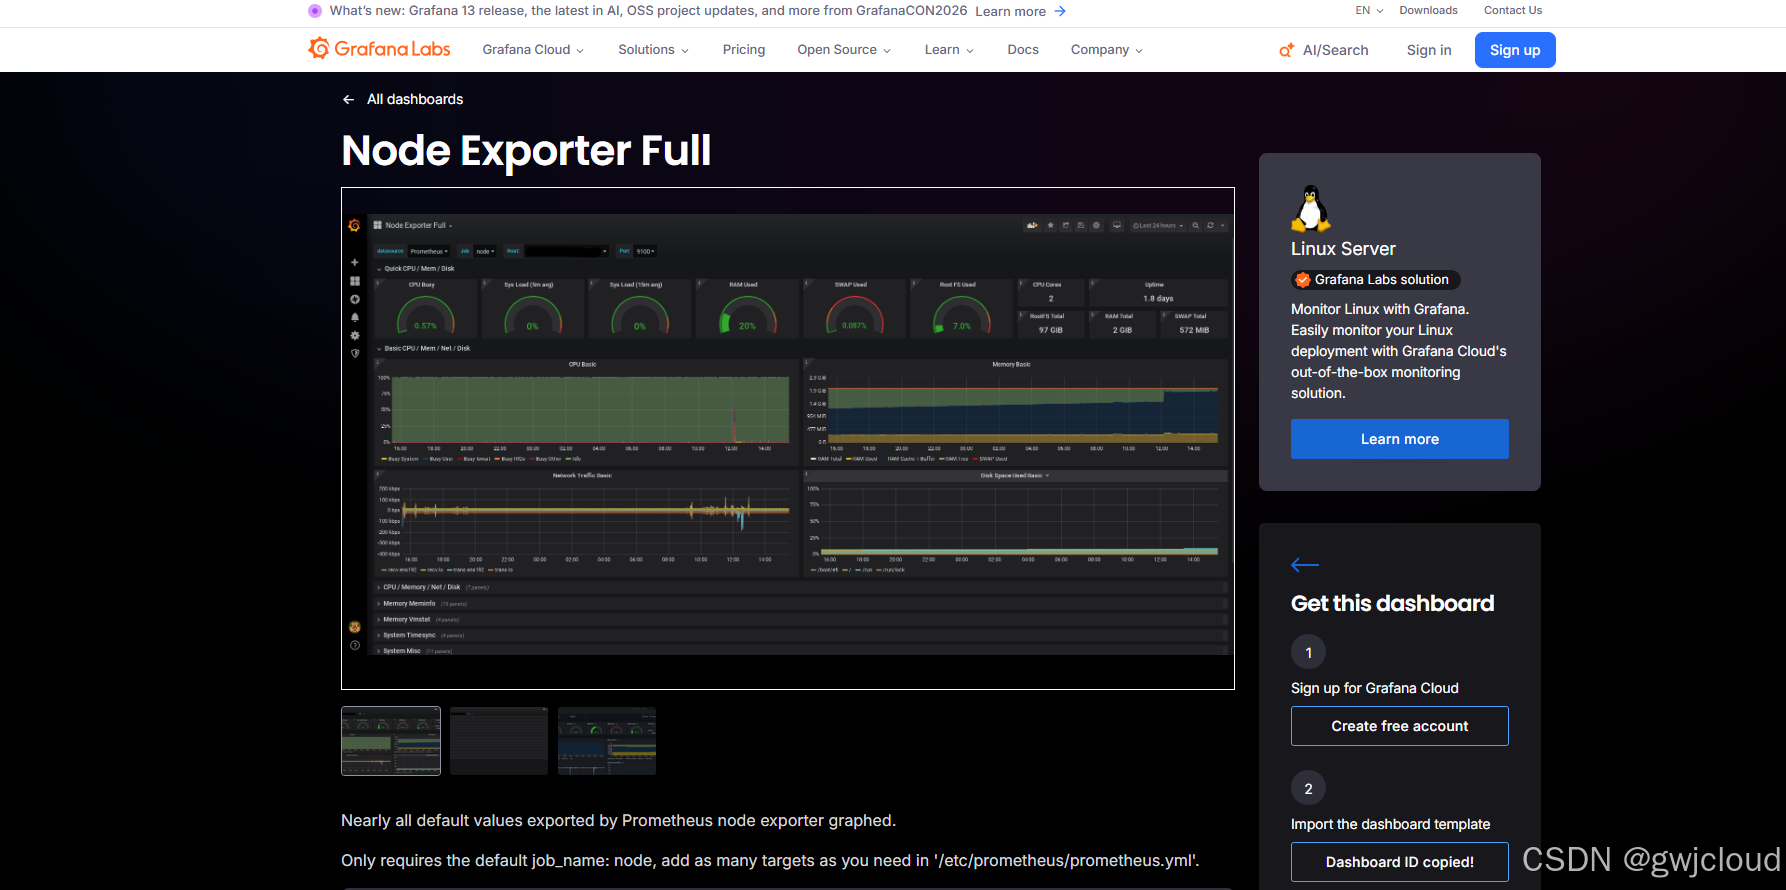
方式一:在线导入
1、点击Create free account复制模板ID
2、在Grafana界面点击Dashboards——NEW——Import
3、在Grafana.com dashboard URL or ID中粘贴复制的模板ID 点击Load
4、自定义输入监控模板的Name,Import完整导入
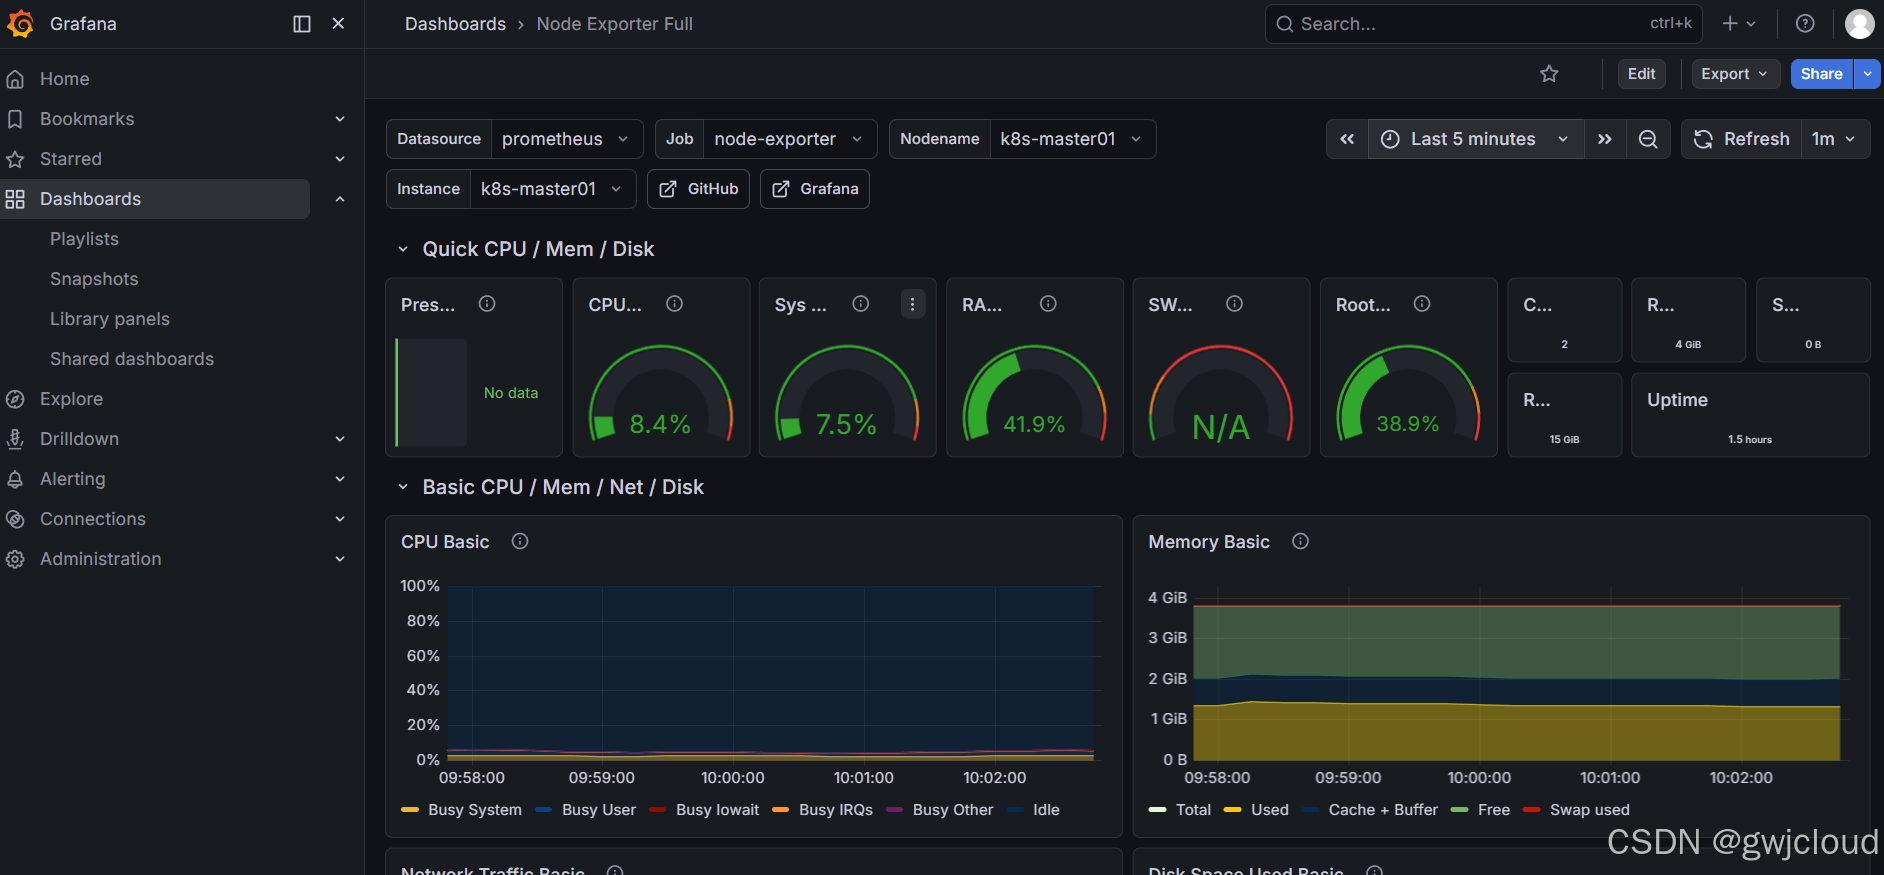
方式二:下载Json文件导入
1、在Grafana官网注册一个账号,登录
2、在模板页面选择下载Json按钮,Download JSON下载到本地
3、在Grafana监控界面,进入Dashboards——New——Import
4、点击Upload JSON file,选择刚下载到本地的Json文件
5、选择Prometheus数据源, Import
6、云原生应用和非云原生的监控流程
不管是云原生还是非云原生,Prometheus 采集数据的核心模式都是 Pull(主动拉取)
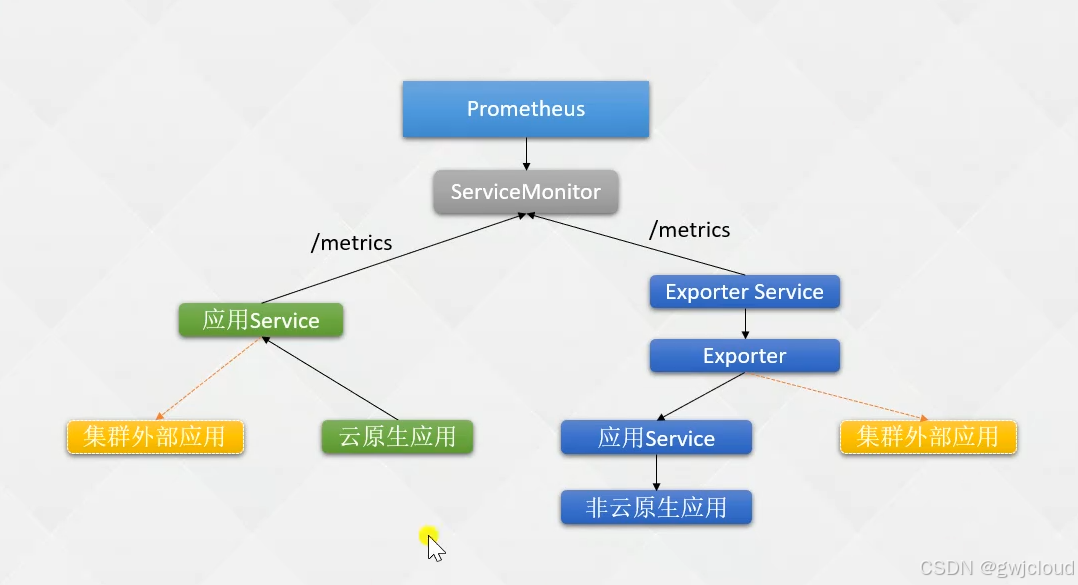
监控数据来源
| 场景 | 采集方式 | 核心组件 / 技术 | 数据路径 |
|---|---|---|---|
| 云原生(K8s 内) | 服务发现自动拉取 | ServiceMonitor/PodMonitor + kube-state-metrics/node-exporter | Pod/Node → /metrics → Prometheus |
| 非云原生(传统 / 第三方) | 静态配置 + Exporter | 第三方 Exporter(如 mysqld_exporter、nginx_exporter) | 应用 → Exporter → /metrics → Prometheus |
就比如云原生应用是通过metrics接口是时间监控数据,在运行kubelet的进程会默认监听一个10255的端口
[root@k8s-master01 ~]# netstat -anplt | grep kubelet
tcp        0      0 127.0.0.1:10248         0.0.0.0:*               LISTEN      1156/kubelet
tcp        0      0 192.168.1.100:42010     192.168.1.100:8443      ESTABLISHED 1156/kubelet
tcp6       0      0 :::10250                :::*                    LISTEN      1156/kubelet
tcp6       0      0 :::10255                :::*                    LISTEN      1156/kubelet


# 访问metrics接口可以看到数据
[root@k8s-master01 ~]# curl 127.0.0.1:10255/metrics
...
workqueue_work_duration_seconds_bucket{name="kubelet_log_rotate_manager",le="0.01"} 3437
workqueue_work_duration_seconds_bucket{name="kubelet_log_rotate_manager",le="0.1"} 3440
workqueue_work_duration_seconds_bucket{name="kubelet_log_rotate_manager",le="1"} 3442
workqueue_work_duration_seconds_bucket{name="kubelet_log_rotate_manager",le="10"} 3442
workqueue_work_duration_seconds_bucket{name="kubelet_log_rotate_manager",le="+Inf"} 3442
workqueue_work_duration_seconds_sum{name="kubelet_log_rotate_manager"} 2.3201565859999937
workqueue_work_duration_seconds_count{name="kubelet_log_rotate_manager"} 3442
什么是Service Monitor
ServiceMonitor 是 Prometheus Operator 用来 “自动找监控目标” 的 K8s 自定义资源(CRD),不用手动改 prometheus.yml。
传统的Prometheus要在配置文件中写死目标
scrape_configs:
  - job_name: 'node-exporter'
    static_configs:
      - targets: ['192.168.1.10:9100']
k8s里pod IP经常变动,服务动态扩缩容,手写IP根本维护不过来
于是Prometheus Operator搞了2个CRD
- ServiceMonitor:通过 Service → 找后端所有 Pod(适合稳定服务)
- PodMonitor:直接匹配 Pod(适合无 Service 的临时 Pod)
[root@k8s-master01 ~]# kubectl get servicemonitors -n monitoring
NAME                      AGE
alertmanager-main         21h
blackbox-exporter         21h
coredns                   21h
grafana                   21h
kube-apiserver            21h
kube-controller-manager   21h
kube-scheduler            21h
kube-state-metrics        21h
kubelet                   21h
node-exporter             21h
prometheus-adapter        21h
prometheus-k8s            21h
prometheus-operator       21h

# 查看node-exporter的yaml文件
[root@k8s-master01 ~]# kubectl get servicemonitors -n monitoring node-exporter -o yaml
...
 selector:
    matchLabels:
      app.kubernetes.io/component: exporter
      app.kubernetes.io/name: node-exporter
      app.kubernetes.io/part-of: kube-prometheus
从这里可以发现是通过service的标签去匹配的

# 查看对应标签的service
[root@k8s-master01 ~]# kubectl get service -n monitoring -l app.kubernetes.io/component=exporter
NAME                 TYPE        CLUSTER-IP      EXTERNAL-IP   PORT(S)              AGE
blackbox-exporter    ClusterIP   10.96.239.192   <none>        9115/TCP,19115/TCP   21h
kube-state-metrics   ClusterIP   None            <none>        8443/TCP,9443/TCP    21h
node-exporter        ClusterIP   None            <none>        9100/TCP             21h
[root@k8s-master01 ~]# kubectl get service -n monitoring -l app.kubernetes.io/component=exporter,app.kubernetes.io/name=node-exporter
NAME            TYPE        CLUSTER-IP   EXTERNAL-IP   PORT(S)    AGE
node-exporter   ClusterIP   None         <none>        9100/TCP   21h
[root@k8s-master01 ~]# kubectl get endpoints -n monitoring node-exporter
Warning: v1 Endpoints is deprecated in v1.33+; use discovery.k8s.io/v1 EndpointSlice
NAME            ENDPOINTS                                                           AGE
node-exporter   192.168.1.10:9100,192.168.1.11:9100,192.168.1.12:9100 + 3 more...   21h
工作原理:
ServiceMonitor → 按标签匹配 Service → 自动拿到 Service 后端所有 Endpoints(Pod:Port)→ Prometheus 自动去抓 /metrics
流程:
Service 打标签(如 app: node-exporter)
写 ServiceMonitor,用 selector 匹配这个标签
Operator 自动把匹配到的 Endpoints 生成 Prometheus 配置
Prometheus 自动抓取,不用重启、不用改配置
云原生应用Etcd监控
用的是 kube-prometheus它自带 etcd 监控,只是 没自动发现、没证书、没 ServiceMonitor,所以没数据。
Etcd也是自带metrics接口的
# 查看etcd的端口
[root@k8s-master01 ~]# netstat -lntp | grep etcd
tcp        0      0 127.0.0.1:2379          0.0.0.0:*               LISTEN      1042/etcd
tcp        0      0 192.168.1.10:2379       0.0.0.0:*               LISTEN      1042/etcd
tcp        0      0 192.168.1.10:2380       0.0.0.0:*               LISTEN      1042/etcd

# 通过端口和接口看访问一下数据
[root@k8s-master01 ~]# curl 127.0.0.1:2379/metrics
promhttp_metric_handler_requests_total{code="503"} 0
...
在Grafana官网找一个etcd的模板 看一下他的要求
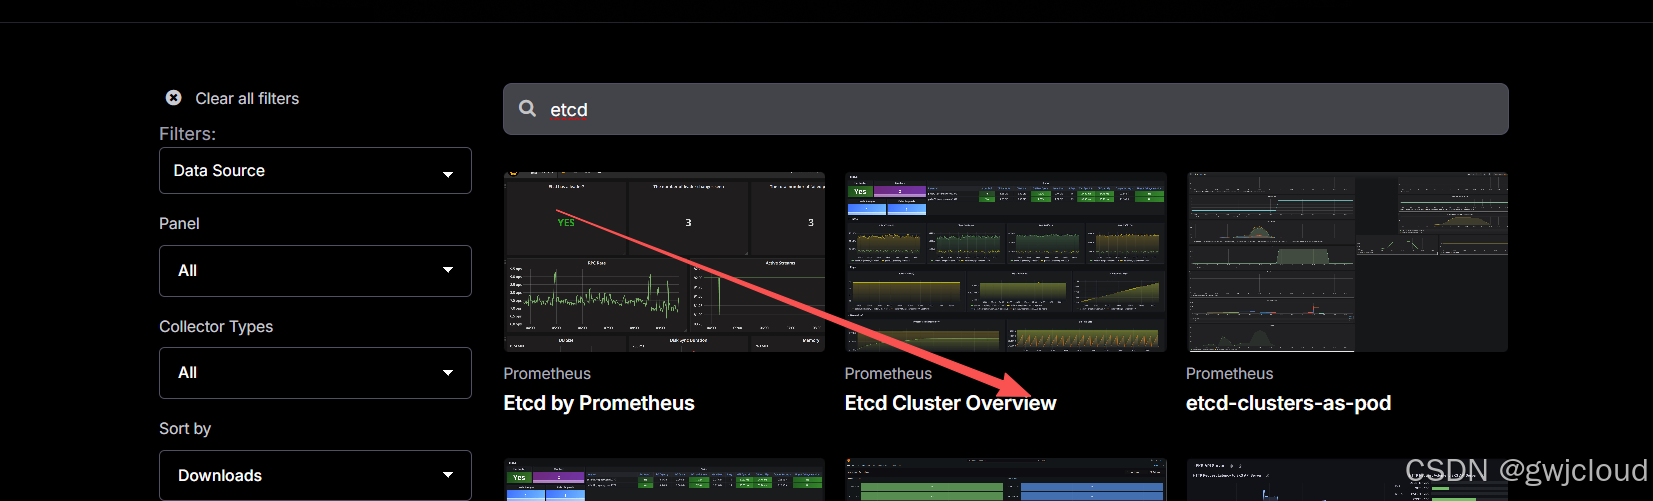
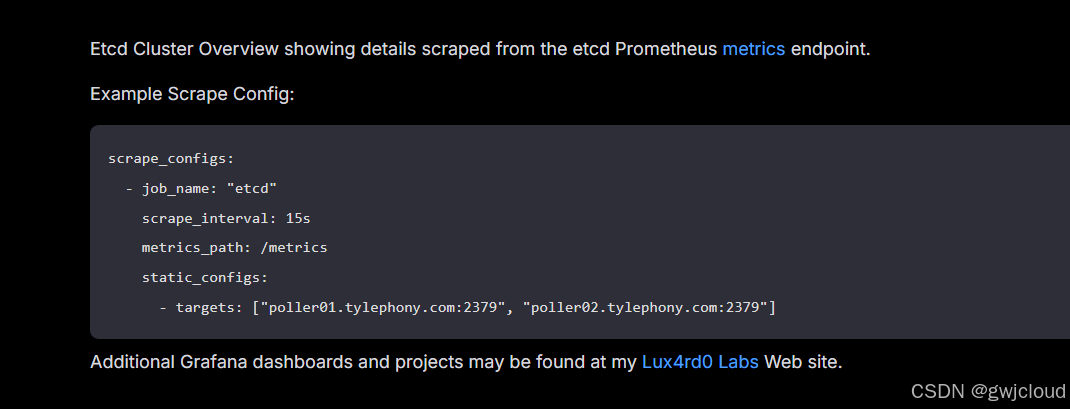
scrape_configs:
  - job_name: "etcd"          # 强制要求 job 名称必须是 "etcd"
    scrape_interval: 15s      # 抓取间隔 15s(和模板示例一致)
    metrics_path: /metrics   # 指标路径固定为 /metrics
    static_configs:
      - targets: ["etcd节点IP:2379"]  # 目标端口固定为 2379(HTTPS)
创建Etcd Service
查看我们Etcd集群的节点和证书存放位置
[root@k8s-master01 ~]# etcdctl --endpoints="192.168.1.10:2379,192.168.1.11:2379,192.168.1.12:2379" \
 --cacert=/etc/kubernetes/pki/etcd/etcd-ca.pem \
 --cert=/etc/kubernetes/pki/etcd/etcd.pem \
 --key=/etc/kubernetes/pki/etcd/etcd-key.pem endpoint status -w table
-----------------+-------------------+
|     ENDPOINT      |        ID        | VERSION | STORAGE VERSION | DB SIZE | IN USE | PERCENTAGE NOT IN USE | QUOTA  | IS LEADER | IS LEARNER | RAFT TERM | RAFT INDEX | RAFT APPLIED INDEX | ERRORS | DOWNGRADE TARGET VERSION | DOWNGRADE ENABLED |
+-------------------+------------------+---------+-----------------+---------+--------+-----------------------+--------+-----------+------------+-----------+------------+--------------------+--------+--------------------------+-------------------+
| 192.168.1.10:2379 | d3bd0760893752a8 |  3.6.10 |           3.6.0 |   23 MB |  10 MB |                   57% | 2.1 GB |     false |      false |        53 |     917196 |             917196 |        |                          |             false |
| 192.168.1.11:2379 | ace8d5b0766b3d92 |  3.6.10 |           3.6.0 |   23 MB | 9.9 MB |                   57% | 2.1 GB |      true |      false |        53 |     917196 |             917196 |        |                          |             false |
| 192.168.1.12:2379 |  ac7e57d44f030e8 |  3.6.10 |           3.6.0 |   24 MB |  10 MB |                   58% | 2.1 GB |     false |      false |        53 |     917196 |             917196 |        |                          |             false |
+-------------------+------------------+---------+-----------------+---------+--------+-----------------------+--------+-----------+------------+-----------+------------+--------------------+--------+--------------------------+-------------------+
节点:192.168.1.10:2379,192.168.1.11:2379,192.168.1.12:2379
证书:
[root@k8s-master01 ~]# ls /etc/kubernetes/pki/etcd/
etcd-ca.csr etcd-ca-key.pem etcd-ca.pem etcd.csr etcd-key.pem etcd.pem
# 创建Etcd 的 Service
[root@k8s-master01 prometheus-etcd]# cat > etcd-prom.yaml << EOF
apiVersion: v1
kind: Endpoints
metadata:
  labels:
    app: etcd-prom
  name: etcd-prom
  namespace: kube-system
subsets:
- addresses:
  - ip: 192.168.1.10
  - ip: 192.168.1.11
  - ip: 192.168.1.12
  ports:
  - name: https-metrics
    port: 2379
    protocol: TCP
---
apiVersion: v1
kind: Service
metadata:
  labels:
    app: etcd-prom
  name: etcd-prom
  namespace: kube-system
spec:
  ports:
  - name: https-metrics
    port: 2379
    protocol: TCP
    targetPort: 2379
  type: ClusterIP
EOF
# apply
[root@k8s-master01 prometheus-etcd]# kubectl apply -f etcd-prom.yaml
# 查看创建出来的Service资源
[root@k8s-master01 prometheus-etcd]# kubectl get svc -n kube-system
NAME TYPE CLUSTER-IP EXTERNAL-IP PORT(S) AGE
etcd-prom ClusterIP 10.96.119.107 <none> 2379/TCP 11s
kube-dns ClusterIP 10.96.0.10 <none> 53/UDP,53/TCP,9153/TCP 23d
kubelet ClusterIP None <none> 10250/TCP,4194/TCP,10255/TCP 23h
metrics-server ClusterIP 10.96.41.20 <none> 443/TCP 23d
# 查看endpoint的信息是否代理上我们的etcd外部ip
[root@k8s-master01 prometheus-etcd]# kubectl get endpoints -n kube-system
Warning: v1 Endpoints is deprecated in v1.33+; use discovery.k8s.io/v1 EndpointSlice
NAME ENDPOINTS AGE
etcd-prom 192.168.1.10:2379,192.168.1.11:2379,192.168.1.12:2379 26s
kube-dns 10.244.195.44:53,10.244.195.44:53,10.244.195.44:9153 23d
kubelet 192.168.1.10:10250,192.168.1.11:10250,192.168.1.12:10250 + 15 more... 23h
metrics-server 10.244.85.237:4443 23d
# 通过Service的IP访问验证
* Connection #0 to host 10.96.119.107 left intact
[root@k8s-master01 prometheus-etcd]# curl -vk --cacert /etc/kubernetes/pki/etcd/etcd-ca.pem --cert /etc/kubernetes/pki/etcd/etcd.pem --key /etc/kubernetes/pki/etcd/etcd-key.pem https://10.96.119.107:2379/metrics
...
创建Etcd Secret
注意对应的证书路径
[root@k8s-master01 prometheus-etcd]# kubectl create secret generic etcd-certs -n monitoring \
  --from-file=ca.crt=/etc/kubernetes/pki/etcd/etcd-ca.pem \
  --from-file=cert.crt=/etc/kubernetes/pki/etcd/etcd.pem \
  --from-file=cert.key=/etc/kubernetes/pki/etcd/etcd-key.pem
将Secret挂载到Prometheus(因为Prometheus是Operator部署的)
[root@k8s-master01 prometheus-etcd]# kubectl edit prometheus k8s -n monitoring
找到 spec: 这一行
spec 下面直接加这两行:
spec:
  secrets:
  - etcd-certs

# 挂载完整prometheus-k8s pod会自动重启
[root@k8s-master01 prometheus-etcd]# kubectl get pod -n monitoring | grep prometheus-k8s
prometheus-k8s-0                       2/2     Running   2 (4h26m ago)   21h
prometheus-k8s-1                       1/2     Running   0               30s
等待全部就绪

# 查看pod中是否挂载
[root@k8s-master01 prometheus-etcd]# kubectl exec -n monitoring prometheus-k8s-0 -c prometheus -- ls /etc/prometheus/secrets/etcd-certs/
ca.crt
cert.crt
cert.key
创建ServiceMonitor
[root@k8s-master01 prometheus-etcd]# cat > etcd-servicemonitor.yaml << EOF
# 监控etcd的ServiceMonitor资源
apiVersion: monitoring.coreos.com/v1
kind: ServiceMonitor
metadata:
  # 名称和前面service保持一致
  name: etcd-prom
  # 固定放在monitoring命名空间
  namespace: monitoring
spec:
  # 匹配带有app: etcd-prom标签的Service
  selector:
    matchLabels:
      app: etcd-prom
  # 只抓取kube-system命名空间下的资源
  namespaceSelector:
    matchNames:
    - kube-system
  endpoints:
  # 对应service里端口名称 https-metrics
  - port: https-metrics
    # 抓取间隔15秒
    interval: 15s
    # etcd指标接口路径
    path: /metrics
    # 采用https协议访问
    scheme: https
    # TLS证书配置
    tlsConfig:
      # prometheus挂载secret后的证书路径
      caFile: /etc/prometheus/secrets/etcd-certs/ca.crt
      certFile: /etc/prometheus/secrets/etcd-certs/cert.crt
      keyFile: /etc/prometheus/secrets/etcd-certs/cert.key
      # 跳过证书主机名校验,解决访问serviceIP证书不匹配问题
      insecureSkipVerify: true

    # 满足Grafana模板要求
    relabelings:
    - targetLabel: job
      replacement: "etcd"
    - targetLabel: service
      replacement: "etcd"

    # 指标重命名兼容老模板
    metricRelabelings:
    - sourceLabels: [__name__]
      regex: "etcd_db_size_bytes"
      targetLabel: "__name__"
      replacement: "etcd_mvcc_db_total_size_in_bytes"
    - sourceLabels: [__name__]
      regex: "etcd_server_leader_changes_seen"
      targetLabel: "__name__"
      replacement: "etcd_server_leader_changes_seen_total"
EOF
# apply
[root@k8s-master01 prometheus-etcd]# kubectl apply -f etcd-servicemonitor.yaml
先去Prometheus的界面看下etcd这个是否up
# 开启Prometheus的Service临时端口,因为我们的Prometheus的service是ClusterIP
[root@k8s-master01 prometheus-etcd]# kubectl port-forward -n monitoring svc/prometheus-k8s 9090:9090 --address 0.0.0.0
去访问节点+端口(开放的)
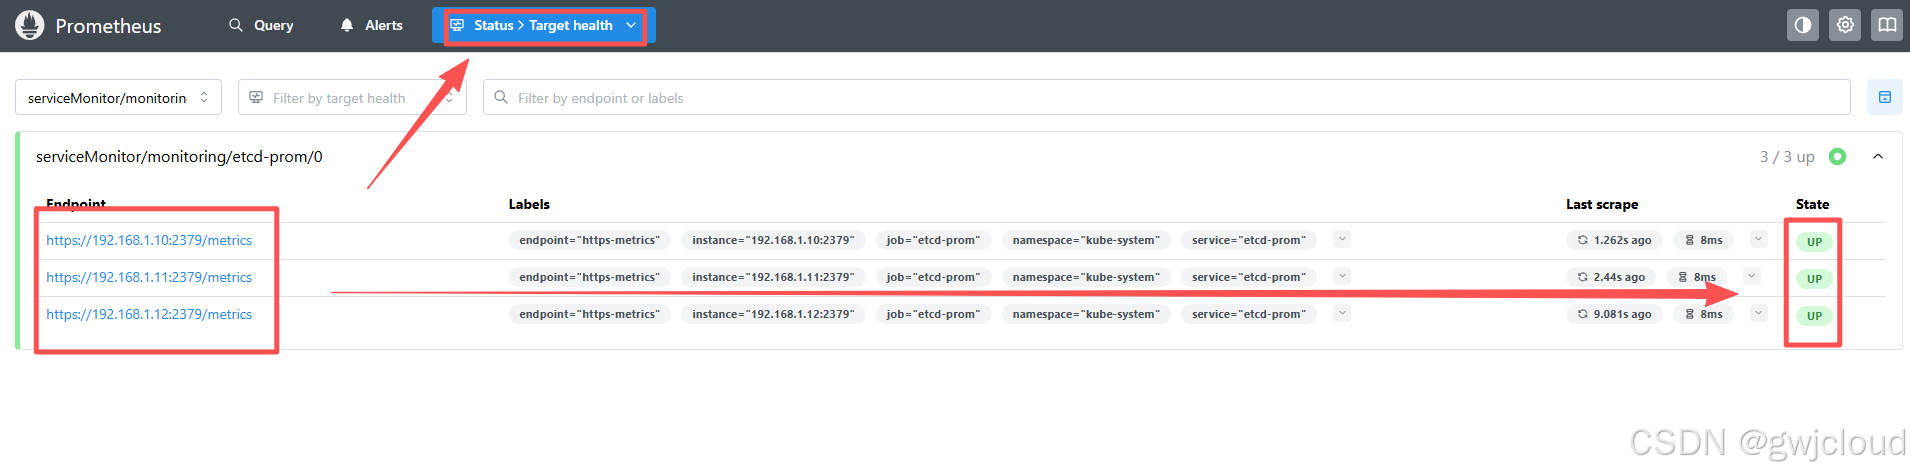
Grafana使用监控Etcd
导入Etcd的监控大盘,导入一开始要导入的模板15308
选择数据来源Prometheus,过程略
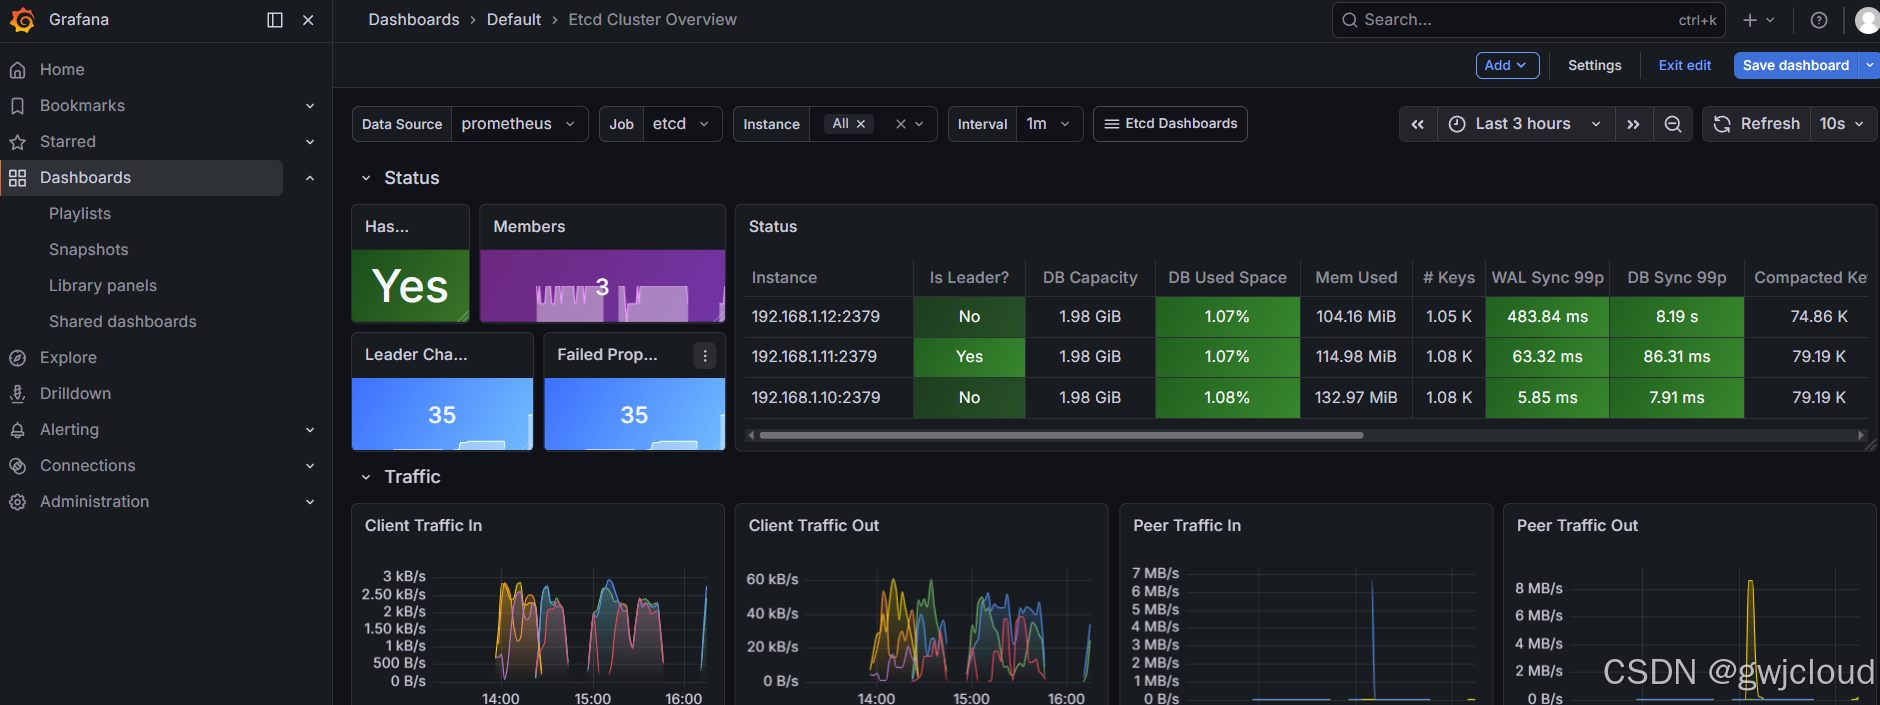
其中有一个是没有数据的Key Operations(ETCD的流量起伏)
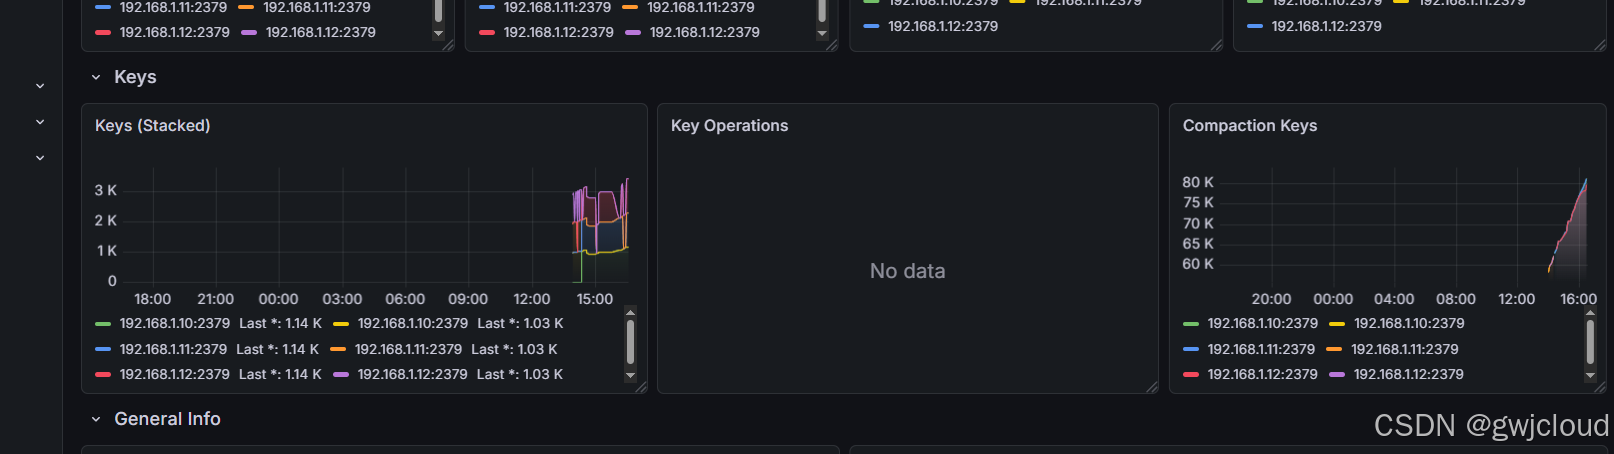
看一下里面的查询语句是这么写的
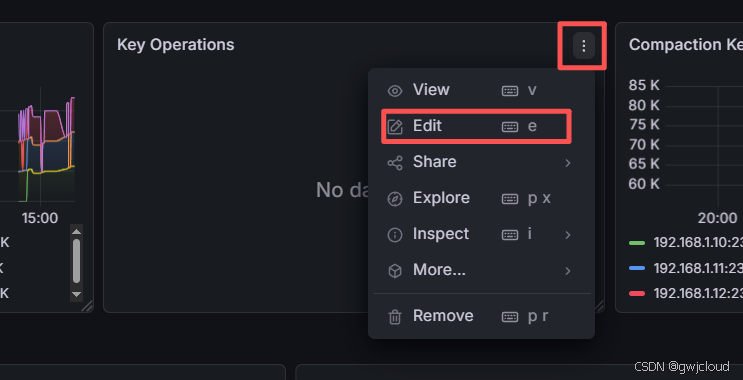
# 可以看到2条PromQL
1. 写入速率
rate(etcd_debugging_mvcc_put_total{instance=~"$instance",job=~"$job"}[5m])

2. 删除速率
rate(etcd_debugging_mvcc_delete_total{instance=~"$instance",job=~"$job"}[5m])
我们的Etcd版本是3.6.10把这2个指标删掉了,需要更改PromQL
写入速率
sum(rate(etcd_mvcc_put_total{job="etcd",instance=~"$instance"}[5m]))


删除速率
sum(rate(etcd_mvcc_put_total{job="etcd",instance=~"$instance"}[5m]))
点击Run queries(应用) Save dashboard (保存)
非云原生的应用的监控
创建测试用例
# 创建测试用例
[root@k8s-67ti0har-0-node ~]# kubectl create deployment mysql --image=mysql:5.7 && kubectl set env deployment/mysql MYSQL_ROOT_PASSWORD=123456
[root@k8s-67ti0har-0-node ~]# kubectl expose deployment mysql --port=3306 --target-port=3306

# 创建监控专用用户
[root@k8s-67ti0har-0-node ~]# kubectl exec -it mysql-56cbf8fb74-spnxf -- bash
bash-4.2# mysql -uroot -p123456
mysql> CREATE USER 'exporter'@'%' IDENTIFIED BY 'exporter' WITH MAX_USER_CONNECTIONS 3;
Query OK, 0 rows affected (0.00 sec)

mysql> GRANT PROCESS, REPLICATION CLIENT, SELECT ON *.* TO 'exporter'@'%';
Query OK, 0 rows affected (0.00 sec)

mysql> FLUSH PRIVILEGES;
Query OK, 0 rows affected (0.00 sec)
创建MySQL Exporter
cat > mysql-exporter.yaml << EOF
apiVersion: v1
kind: ConfigMap
metadata:
  name: mysql-exporter-config
  namespace: monitoring
data:
  my.cnf: |
    [client]
    user = exporter
    password = exporter
    host = mysql.default.svc.cluster.local
    port = 3306

---
apiVersion: v1
kind: Service
metadata:
  name: mysql-exporter
  namespace: monitoring
  labels:
    k8s-app: mysql-exporter
spec:
  type: ClusterIP
  selector:
    k8s-app: mysql-exporter
  ports:
  - name: api
    port: 9104
    targetPort: 9104

---
apiVersion: apps/v1
kind: Deployment
metadata:
  name: mysql-exporter
  namespace: monitoring
spec:
  replicas: 1
  selector:
    matchLabels:
      k8s-app: mysql-exporter
  template:
    metadata:
      labels:
        k8s-app: mysql-exporter
    spec:
      containers:
      - name: mysql-exporter
        image: docker.io/prom/mysqld-exporter:latest
        args:
        - --config.my-cnf=/my.cnf
        volumeMounts:
        - name: config
          mountPath: /my.cnf
          subPath: my.cnf
        ports:
        - containerPort: 9104
      volumes:
      - name: config
        configMap:
          name: mysql-exporter-config
EOF
[root@k8s-67ti0har-0-node ~]# kubectl apply -f mysql-exporter.yaml
通过svc的地址接口拿到metrics的数据
[root@k8s-67ti0har-0-node ~]# curl 192.168.124.115:9104/metrics
创建ServiceMonitor
cat > mysql-sm.yaml << EOF
apiVersion: monitoring.coreos.com/v1
kind: ServiceMonitor
metadata:
  name: mysql-exporter
  namespace: monitoring
  labels:
    k8s-app: mysql-exporter
spec:
  jobLabel: k8s-app
  endpoints:
  - port: api
    interval: 30s
    scheme: http
  selector:
    matchLabels:
      k8s-app: mysql-exporter
  namespaceSelector:
    matchNames:
    - monitoring
EOF

# apply
kubectl apply -f mysql-sm.yaml

# 检查 ServiceMonitor 是否创建成功
kubectl get servicemonitors -n monitoring mysql-exporter

# 检查 Prometheus 配置是否加载(需要 prometheus-operator 支持)
kubectl get prometheus -n monitoring -o yaml | grep -A 10 "serviceMonitorNamespaceSelector"
查看Prometheus是否监控到

Garfana导入自定义的监控数据
Json文件
{
"annotations": {
"list": [
{
"builtIn": 1,
"datasource": "-- Grafana --",
"enable": true,
"hide": true,
"iconColor": "rgba(0, 211, 255, 1)",
"name": "Annotations & Alerts",
"type": "dashboard"
}
]
},
"editable": true,
"gnetId": null,
"graphTooltip": 0,
"id": null,
"links": [],
"panels": [
{
"collapsed": false,
"gridPos": {
"h": 1,
"w": 24,
"x": 0,
"y": 0
},
"id": 1,
"panels": [],
"title": "基础状态概览",
"type": "row"
},
{
"aliasColors": {},
"bars": false,
"dashLength": 10,
"dashes": false,
"datasource": {
"type": "prometheus",
"uid": "prometheus"
},
"fieldConfig": {
"defaults": {
"color": {
"mode": "palette-classic"
},
"custom": {
"axisCenteredZero": false,
"axisColorMode": "text",
"axisLabel": "",
"axisPlacement": "auto",
"barAlignment": 0,
"drawStyle": "line",
"fillOpacity": 10,
"gradientMode": "none",
"hideFrom": {
"legend": false,
"tooltip": false,
"viz": false
},
"lineInterpolation": "linear",
"lineWidth": 1,
"pointSize": 5,
"scaleDistribution": {
"type": "linear"
},
"showPoints": "auto",
"spanNulls": false,
"stacking": {
"group": "A",
"mode": "none"
},
"thresholdsStyle": {
"mode": "off"
}
},
"mappings": [],
"thresholds": {
"mode": "absolute",
"steps": [
{
"color": "green",
"value": null
}
]
},
"unit": "short"
},
"overrides": []
},
"fill": 1,
"fillGradient": 0,
"gridPos": {
"h": 8,
"w": 12,
"x": 0,
"y": 1
},
"hiddenSeries": false,
"id": 2,
"legend": {
"avg": false,
"current": false,
"max": false,
"min": false,
"show": true,
"total": false,
"values": false
},
"lines": true,
"linewidth": 1,
"nullPointMode": "null",
"options": {
"alertThreshold": true
},
"percentage": false,
"pluginVersion": "10.4.0",
"pointradius": 2,
"points": false,
"renderer": "flot",
"seriesOverrides": [],
"spaceLength": 10,
"stack": false,
"steppedLine": false,
"targets": [
{
"expr": "mysql_global_status_aborted_clients{job=\"mysql-exporter\"}",
"interval": "",
"legendFormat": "异常客户端",
"refId": "A"
},
{
"expr": "mysql_global_status_aborted_connects{job=\"mysql-exporter\"}",
"interval": "",
"legendFormat": "异常连接",
"refId": "B"
}
],
"thresholds": [],
"timeFrom": null,
"timeRegions": [],
"timeShift": null,
"title": "异常连接统计",
"tooltip": {
"shared": true,
"sort": 0,
"value_type": "individual"
},
"type": "timeseries",
"xaxis": {
"buckets": null,
"mode": "time",
"name": null,
"show": true,
"values": []
},
"yaxes": [
{
"format": "short",
"label": "次数",
"logBase": 1,
"max": null,
"min": "0",
"show": true
},
{
"format": "short",
"label": null,
"logBase": 1,
"max": null,
"min": null,
"show": true
}
],
"yaxis": {
"align": false,
"alignLevel": null
}
},
{
"aliasColors": {},
"bars": false,
"dashLength": 10,
"dashes": false,
"datasource": {
"type": "prometheus",
"uid": "prometheus"
},
"fieldConfig": {
"defaults": {
"color": {
"mode": "palette-classic"
},
"custom": {
"axisCenteredZero": false,
"axisColorMode": "text",
"axisLabel": "",
"axisPlacement": "auto",
"barAlignment": 0,
"drawStyle": "line",
"fillOpacity": 10,
"gradientMode": "none",
"hideFrom": {
"legend": false,
"tooltip": false,
"viz": false
},
"lineInterpolation": "linear",
"lineWidth": 1,
"pointSize": 5,
"scaleDistribution": {
"type": "linear"
},
"showPoints": "auto",
"spanNulls": false,
"stacking": {
"group": "A",
"mode": "none"
},
"thresholdsStyle": {
"mode": "off"
}
},
"mappings": [],
"thresholds": {
"mode": "absolute",
"steps": [
{
"color": "green",
"value": null
}
]
},
"unit": "s"
},
"overrides": []
},
"fill": 1,
"fillGradient": 0,
"gridPos": {
"h": 8,
"w": 12,
"x": 12,
"y": 1
},
"hiddenSeries": false,
"id": 3,
"legend": {
"avg": false,
"current": false,
"max": false,
"min": false,
"show": true,
"total": false,
"values": false
},
"lines": true,
"linewidth": 1,
"nullPointMode": "null",
"options": {
"alertThreshold": true
},
"percentage": false,
"pluginVersion": "10.4.0",
"pointradius": 2,
"points": false,
"renderer": "flot",
"seriesOverrides": [],
"spaceLength": 10,
"stack": false,
"steppedLine": false,
"targets": [
{
"expr": "mysql_exporter_collector_duration_seconds{job=\"mysql-exporter\"}",
"interval": "",
"legendFormat": "采集耗时",
"refId": "A"
}
],
"thresholds": [],
"timeFrom": null,
"timeRegions": [],
"timeShift": null,
"title": "Exporter 采集耗时",
"tooltip": {
"shared": true,
"sort": 0,
"value_type": "individual"
},
"type": "timeseries",
"xaxis": {
"buckets": null,
"mode": "time",
"name": null,
"show": true,
"values": []
},
"yaxes": [
{
"format": "s",
"label": "耗时(秒)",
"logBase": 1,
"max": null,
"min": "0",
"show": true
},
{
"format": "short",
"label": null,
"logBase": 1,
"max": null,
"min": null,
"show": true
}
],
"yaxis": {
"align": false,
"alignLevel": null
}
},
{
"collapsed": false,
"gridPos": {
"h": 1,
"w": 24,
"x": 0,
"y": 9
},
"id": 4,
"panels": [],
"title": "缓冲池状态",
"type": "row"
},
{
"aliasColors": {},
"bars": false,
"dashLength": 10,
"dashes": false,
"datasource": {
"type": "prometheus",
"uid": "prometheus"
},
"fieldConfig": {
"defaults": {
"color": {
"mode": "palette-classic"
},
"custom": {
"axisCenteredZero": false,
"axisColorMode": "text",
"axisLabel": "",
"axisPlacement": "auto",
"barAlignment": 0,
"drawStyle": "line",
"fillOpacity": 10,
"gradientMode": "none",
"hideFrom": {
"legend": false,
"tooltip": false,
"viz": false
},
"lineInterpolation": "linear",
"lineWidth": 1,
"pointSize": 5,
"scaleDistribution": {
"type": "linear"
},
"showPoints": "auto",
"spanNulls": false,
"stacking": {
"group": "A",
"mode": "none"
},
"thresholdsStyle": {
"mode": "off"
}
},
"mappings": [],
"thresholds": {
"mode": "absolute",
"steps": [
{
"color": "green",
"value": null
}
]
},
"unit": "short"
},
"overrides": []
},
"fill": 1,
"fillGradient": 0,
"gridPos": {
"h": 8,
"w": 12,
"x": 0,
"y": 10
},
"hiddenSeries": false,
"id": 5,
"legend": {
"avg": false,
"current": false,
"max": false,
"min": false,
"show": true,
"total": false,
"values": false
},
"lines": true,
"linewidth": 1,
"nullPointMode": "null",
"options": {
"alertThreshold": true
},
"percentage": false,
"pluginVersion": "10.4.0",
"pointradius": 2,
"points": false,
"renderer": "flot",
"seriesOverrides": [],
"spaceLength": 10,
"stack": false,
"steppedLine": false,
"targets": [
{
"expr": "mysql_global_status_buffer_pool_pages{state=\"free\", job=\"mysql-exporter\"}",
"interval": "",
"legendFormat": "空闲页",
"refId": "A"
},
{
"expr": "mysql_global_status_buffer_pool_pages{state=\"data\", job=\"mysql-exporter\"}",
"interval": "",
"legendFormat": "数据页",
"refId": "B"
}
],
"thresholds": [],
"timeFrom": null,
"timeRegions": [],
"timeShift": null,
"title": "缓冲池页状态",
"tooltip": {
"shared": true,
"sort": 0,
"value_type": "individual"
},
"type": "timeseries",
"xaxis": {
"buckets": null,
"mode": "time",
"name": null,
"show": true,
"values": []
},
"yaxes": [
{
"format": "short",
"label": "页数",
"logBase": 1,
"max": null,
"min": "0",
"show": true
},
{
"format": "short",
"label": null,
"logBase": 1,
"max": null,
"min": null,
"show": true
}
],
"yaxis": {
"align": false,
"alignLevel": null
}
},
{
"aliasColors": {},
"bars": false,
"dashLength": 10,
"dashes": false,
"datasource": {
"type": "prometheus",
"uid": "prometheus"
},
"fieldConfig": {
"defaults": {
"color": {
"mode": "palette-classic"
},
"custom": {
"axisCenteredZero": false,
"axisColorMode": "text",
"axisLabel": "",
"axisPlacement": "auto",
"barAlignment": 0,
"drawStyle": "line",
"fillOpacity": 10,
"gradientMode": "none",
"hideFrom": {
"legend": false,
"tooltip": false,
"viz": false
},
"lineInterpolation": "linear",
"lineWidth": 1,
"pointSize": 5,
"scaleDistribution": {
"type": "linear"
},
"showPoints": "auto",
"spanNulls": false,
"stacking": {
"group": "A",
"mode": "none"
},
"thresholdsStyle": {
"mode": "off"
}
},
"mappings": [],
"thresholds": {
"mode": "absolute",
"steps": [
{
"color": "green",
"value": null
}
]
},
"unit": "short"
},
"overrides": []
},
"fill": 1,
"fillGradient": 0,
"gridPos": {
"h": 8,
"w": 12,
"x": 12,
"y": 10
},
"hiddenSeries": false,
"id": 6,
"legend": {
"avg": false,
"current": false,
"max": false,
"min": false,
"show": true,
"total": false,
"values": false
},
"lines": true,
"linewidth": 1,
"nullPointMode": "null",
"options": {
"alertThreshold": true
},
"percentage": false,
"pluginVersion": "10.4.0",
"pointradius": 2,
"points": false,
"renderer": "flot",
"seriesOverrides": [],
"spaceLength": 10,
"stack": false,
"steppedLine": false,
"targets": [
{
"expr": "mysql_global_status_buffer_pool_page_changes_total{job=\"mysql-exporter\"}",
"interval": "",
"legendFormat": "页变更总数",
"refId": "A"
},
{
"expr": "mysql_global_status_buffer_pool_pages_dirty{job=\"mysql-exporter\"}",
"interval": "",
"legendFormat": "脏页数量",
"refId": "B"
}
],
"thresholds": [],
"timeFrom": null,
"timeRegions": [],
"timeShift": null,
"title": "缓冲池脏页与变更",
"tooltip": {
"shared": true,
"sort": 0,
"value_type": "individual"
},
"type": "timeseries",
"xaxis": {
"buckets": null,
"mode": "time",
"name": null,
"show": true,
"values": []
},
"yaxes": [
{
"format": "short",
"label": "数量",
"logBase": 1,
"max": null,
"min": "0",
"show": true
},
{
"format": "short",
"label": null,
"logBase": 1,
"max": null,
"min": null,
"show": true
}
],
"yaxis": {
"align": false,
"alignLevel": null
}
}
],
"refresh": "10s",
"schemaVersion": 38,
"style": "dark",
"tags": ["mysql", "prometheus", "kubernetes"],
"templating": {
"list": []
},
"time": {
"from": "now-6h",
"to": "now"
},
"timepicker": {
"refresh_intervals": [
"5s",
"10s",
"30s",
"1m",
"5m",
"15m",
"30m",
"1h",
"2h",
"1d"
]
},
"timezone": "",
"title": "MySQL 适配版监控面板",
"uid": "mysql-adapted",
"version": 1
}导入过程略
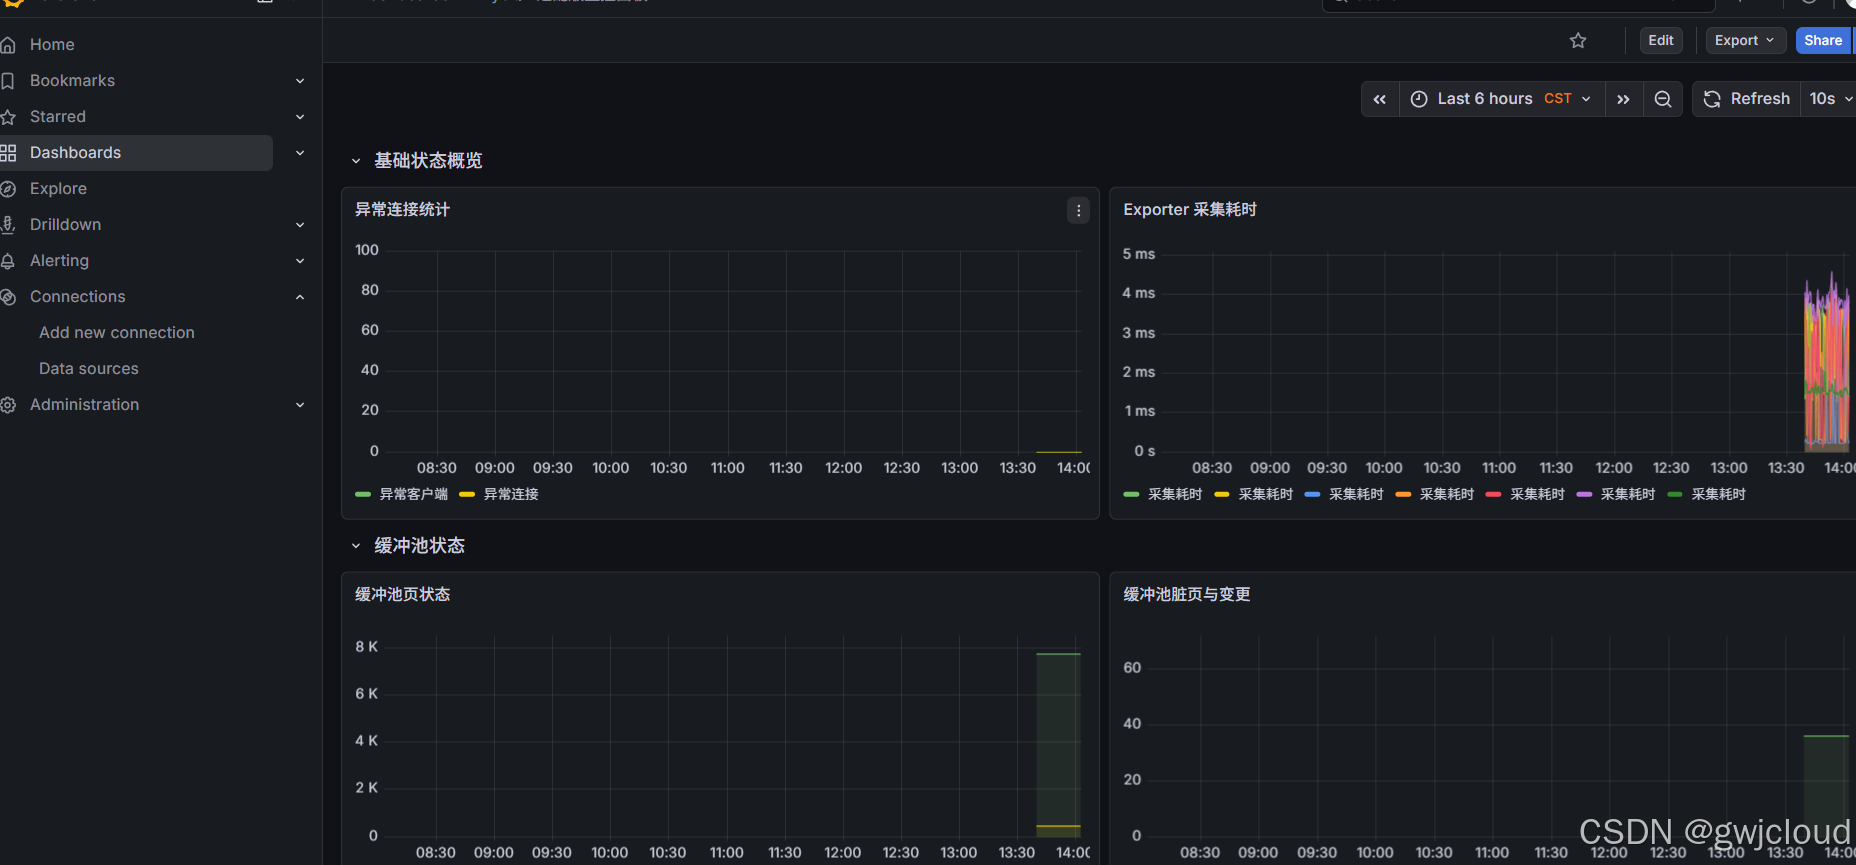
7、黑盒监控
白盒监控:程序内部的一些指标,这类监控专注的点是原因,也就是一般为出现问题的根本,此类监控称为白盒监控,主要关注的是原因。
黑盒监控:监控关注的是现象,也就是正在发生的告警,比如某个网站突然慢了,或者是打不开了。此类告警是站在用户的角度看到的东西,比较关注现象,表示正在发生的问题,这类监控称为黑盒监控
新版的Prometheus Stack已经默认安装了Blackbox Exporter,可以通过以下命令查看
[root@k8s-67ti0har-0-node ~]# kubectl get pod -n monitoring | grep blackbox-exporter
blackbox-exporter-7fbddb9bfd-ql4qn     3/3     Running   0          4m8s
同时也会创建一个Service
[root@k8s-67ti0har-0-node ~]# kubectl get service -n monitoring | grep blackbox-exporter
blackbox-exporter       ClusterIP   192.168.71.89     <none>        9115/TCP,19115/TCP           4m21s
可以先测试用Blackbox的ip去探测一个域名是否正常
[root@k8s-67ti0har-0-node ~]# curl "http://192.168.71.89:19115/probe?module=http_2xx&target=https://www.baidu.com" | grep probe_success
  % Total    % Received % Xferd  Average Speed   Time    Time     Time  Current
                                 Dload  Upload   Total   Spent    Left  Speed
100  4079    0  4079    0     0  12032      0 --:--:-- --:--:-- --:--:-- 12032
# HELP probe_success Displays whether or not the probe was a success
# TYPE probe_success gauge
probe_success 1


Probe是接口地址
Target是检查的目标
Module是使用哪个模块进行探测
# 1. 创建空配置文件(用来写额外的 Prometheus 抓取规则)
touch prometheus-additional.yaml
# 2. 把这个文件打包成 Kubernetes Secret,供 Prometheus 挂载使用
[root@k8s-67ti0har-0-node ~]# kubectl create secret generic additional-configs --from-file=prometheus-additional.yaml -n monitoring
# 3. 编辑Prometheus的配置
[root@k8s-67ti0har-0-node ~]# kubectl edit prometheus k8s -n monitoring
spec:
# 添加以下配置3行
additionalScrapeConfigs:
key: prometheus-additional.yaml
name: additional-configs
optional: true
alerting:
alertmanagers:
添加上述配置后,无需重启Prometheus的pod即可生效
在prometheus-additional.yaml文件中编辑一些静态配置
[root@k8s-67ti0har-0-node ~]# vim prometheus-additional.yaml
- job_name: 'blackbox'
  metrics_path: /probe
  params:
    module: [http_2xx]  # Look for a HTTP 200 response.
  static_configs:
    - targets:
      - http://gaoxin.kubeeasy.com   # Target to probe with http.
      - https://www.baidu.com        # Target to probe with https.
  relabel_configs:
    - source_labels: [__address__]
      target_label: __param_target
    - source_labels: [__param_target]
      target_label: instance
    - target_label: __address__
      replacement: blackbox-exporter:19115
Secret 热更新
[root@k8s-67ti0har-0-node ~]# kubectl create secret generic additional-configs --from-file=prometheus-additional.yaml -n monitoring --dry-run=client -o yaml | kubectl replace -f -


# 查看数据是否更新
[root@k8s-67ti0har-0-node ~]# kubectl get secret -n monitoring additional-configs -o yaml
apiVersion: v1
data:
  prometheus-additional.yaml: LSBqb2JfbmFtZTogJ2JsYWNrYm94JwogIG1ldHJpY3NfcGF0aDogL3Byb2JlCiAgcGFyYW1zOgogICAgbW9kdWxlOiBbaHR0cF8yeHhdICAjIExvb2sgZm9yIGEgSFRUUCAyMDAgcmVzcG9uc2UuCiAgc3RhdGljX2NvbmZpZ3M6CiAgICAtIHRhcmdldHM6CiAgICAgIC0gaHR0cDovL2dhb3hpbi5rdWJlZWFzeS5jb20gICAjIFRhcmdldCB0byBwcm9iZSB3aXRoIGh0dHAuCiAgICAgIC0gaHR0cHM6Ly93d3cuYmFpZHUuY29tICAgICAgICAjIFRhcmdldCB0byBwcm9iZSB3aXRoIGh0dHBzLgogIHJlbGFiZWxfY29uZmlnczoKICAgIC0gc291cmNlX2xhYmVsczogW19fYWRkcmVzc19fXQogICAgICB0YXJnZXRfbGFiZWw6IF9fcGFyYW1fdGFyZ2V0CiAgICAtIHNvdXJjZV9sYWJlbHM6IFtfX3BhcmFtX3RhcmdldF0KICAgICAgdGFyZ2V0X2xhYmVsOiBpbnN0YW5jZQogICAgLSB0YXJnZXRfbGFiZWw6IF9fYWRkcmVzc19fCiAgICAgIHJlcGxhY2VtZW50OiBibGFja2JveC1leHBvcnRlcjoxOTExNQo=
kind: Secret
metadata:
  creationTimestamp: "2026-05-14T03:59:36Z"
  name: additional-configs
  namespace: monitoring
  resourceVersion: "2038040754"
  uid: cf05d242-78f0-4636-9be2-af4f80584fbd
type: Opaque


# 解码
[root@k8s-67ti0har-0-node ~]# echo "LSBqb2JfbmFtZTogJ2JsYWNrYm94JwogIG1ldHJpY3NfcGF0aDogL3Byb2JlCiAgcGFyYW1zOgogICAgbW9kdWxlOiBbaHR0cF8yeHhdICAjIExvb2sgZm9yIGEgSFRUUCAyMDAgcmVzcG9uc2UuCiAgc3RhdGljX2NvbmZpZ3M6CiAgICAtIHRhcmdldHM6CiAgICAgIC0gaHR0cDovL2dhb3hpbi5rdWJlZWFzeS5jb20gICAjIFRhcmdldCB0byBwcm9iZSB3aXRoIGh0dHAuCiAgICAgIC0gaHR0cHM6Ly93d3cuYmFpZHUuY29tICAgICAgICAjIFRhcmdldCB0byBwcm9iZSB3aXRoIGh0dHBzLgogIHJlbGFiZWxfY29uZmlnczoKICAgIC0gc291cmNlX2xhYmVsczogW19fYWRkcmVzc19fXQogICAgICB0YXJnZXRfbGFiZWw6IF9fcGFyYW1fdGFyZ2V0CiAgICAtIHNvdXJjZV9sYWJlbHM6IFtfX3BhcmFtX3RhcmdldF0KICAgICAgdGFyZ2V0X2xhYmVsOiBpbnN0YW5jZQogICAgLSB0YXJnZXRfbGFiZWw6IF9fYWRkcmVzc19fCiAgICAgIHJlcGxhY2VtZW50OiBibGFja2JveC1leHBvcnRlcjoxOTExNQo=" | base64 -d
- job_name: 'blackbox'
  metrics_path: /probe
  params:
    module: [http_2xx]  # Look for a HTTP 200 response.
  static_configs:
    - targets:
      - http://gaoxin.kubeeasy.com   # Target to probe with http.
      - https://www.baidu.com        # Target to probe with https.
  relabel_configs:
    - source_labels: [__address__]
      target_label: __param_target
    - source_labels: [__param_target]
      target_label: instance
    - target_label: __address__
      replacement: blackbox-exporter:19115
开启Prometheus的端口转发是否查询监控是否up
[root@k8s-67ti0har-0-node ~]# kubectl port-forward -n monitoring svc/prometheus-k8s 9090:9090 --address 0.0.0.0

导入Grafana监控面板ID 13659
修改HTTP Probe Overview的PromQL
修改完成后Save dashboard —— Sava
# 1. 探测状态
probe_success{job="blackbox"}

# 2. SSL 证书是否存在
probe_http_ssl{job="blackbox"} > 0

# 3. SSL 证书剩余天数
(probe_ssl_earliest_cert_expiry{job="blackbox"} - time()) / 3600 / 24

# 4. HTTP 状态码
probe_http_status_code{job="blackbox"} > 0

# 5. 1 分钟平均响应时间
avg_over_time(probe_duration_seconds{job="blackbox"}[1m])

# 6. TLS 版本信息
probe_tls_version_info{job="blackbox"}

# 7. 1 分钟平均 DNS 解析时间
avg_over_time(probe_dns_lookup_time_seconds{job="blackbox"}[1m])
修改HTTP Probe Duration的PromQL
修改完成后Save dashboard —— Sava
HTTP 探测总耗时的聚合查询
sum(probe_duration_seconds{job="blackbox"}) by (instance)
修改HTTP Probe Phases Duration的PromQL
修改完成后Save dashboard —— Sava
HTTP 探测各阶段耗时
probe_http_duration_seconds{job="blackbox"}
最终界面
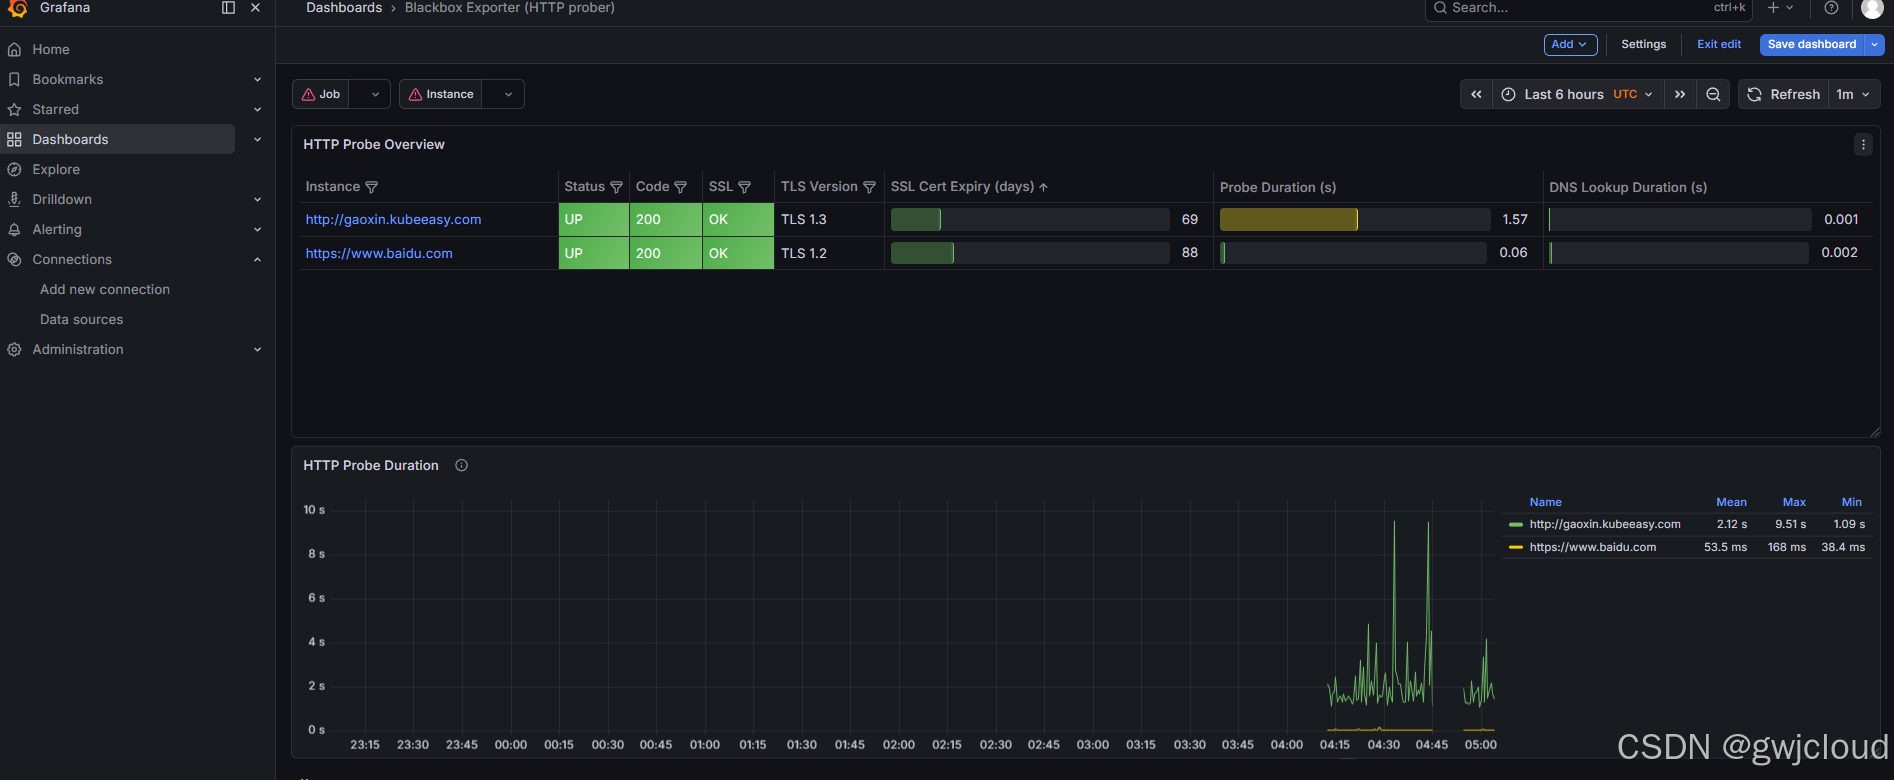
8、Prometheus 语法 PromQL
PromQL(Prometheus Query Language)是 Prometheus 内置的函数式查询语言,核心作用是实时筛选、聚合和计算时间序列监控数据,是实现数据可视化、告警规则的基础。
PromQL初体验
# 修改Prometheus的service的类型
[root@k8s-67ti0har-0-node ~]# kubectl patch svc prometheus-k8s -n monitoring -p '{"spec":{"type":"NodePort"}}'
service/prometheus-k8s patched
[root@k8s-67ti0har-0-node ~]# kubectl get svc -n monitoring | grep prometheus-k8s
prometheus-k8s          NodePort    192.168.4.214     <none>        9090:31264/TCP,8080:31961/TCP   3h20m
PromQL Web UI的Graph选项卡提供了简单的用于查询数据的入口,对于 PromQL的编写和校验都可以在此位置,如图所示:
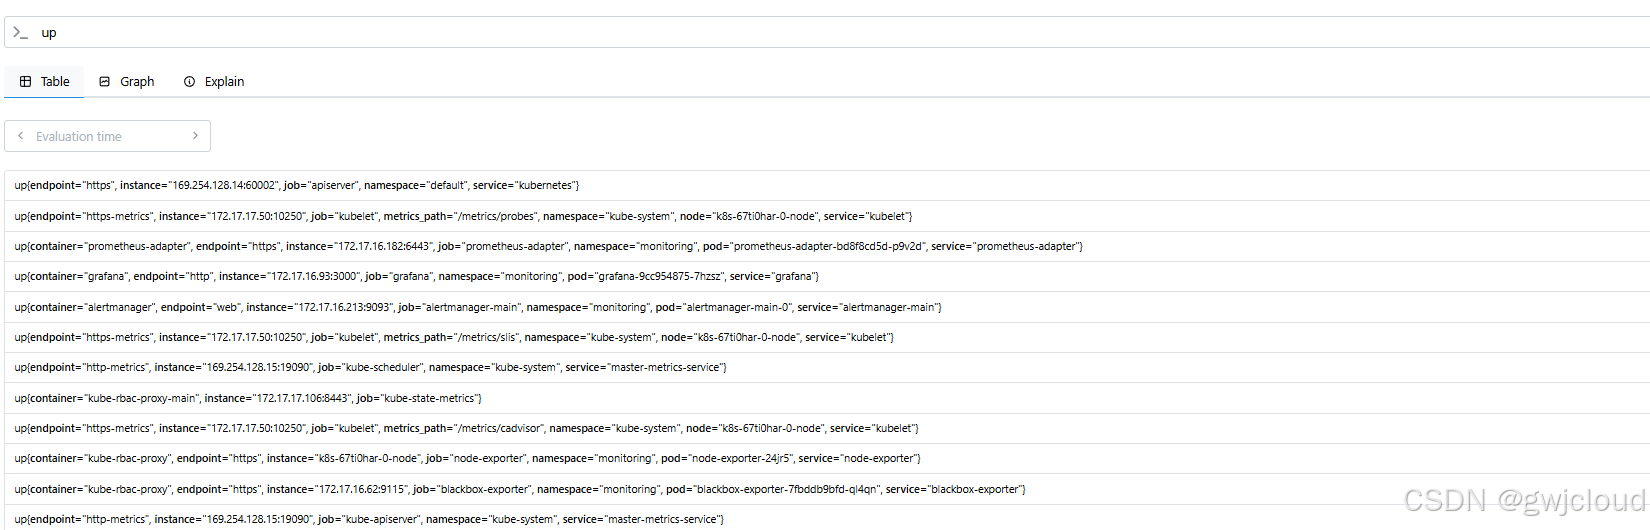
先分清 2 个核心概念
- 即时向量:某一瞬间所有监控值
- 范围向量:一段时间内所有数据点,加 [时间] 如 [5m]
1. 查原始指标(最简单)
# 节点CPU空闲时间计数器
node_cpu_seconds_total

2. 标签精准过滤
只看空闲模式、指定节点:
node_cpu_seconds_total{mode="idle"}
正则匹配多个节点:
node_cpu_seconds_total{instance=~"10.0.3.10|10.0.3.11"}

3.范围向量入门(加时间窗口)
取最近 5 分钟的数据点:
node_cpu_seconds_total{mode="idle"}[5m]
PromQL操作符
四大类操作符
- 算术操作符
- 比较操作符
- 集合 / 逻辑操作符
- 向量匹配操作符
1. 算术操作符
+ - * / % ^
支持:向量 与 标量、向量 与 向量 运算
# CPU使用率转百分比
(1 - avg(rate(node_cpu_seconds_total{mode="idle"}[5m])) by (instance)) * 100

# 剩余内存 GB
node_memory_MemFree_bytes / 1024 / 1024 / 1024
2. 比较操作符
== != > < >= <=
特点:满足条件返回值,不满足直接过滤掉
# 找出CPU使用率大于80%的节点
(1 - avg(rate(node_cpu_seconds_total{mode="idle"}[5m])) by (instance)) * 100 > 80
# 内存可用小于5G
node_memory_MemFree_bytes / 1024/1024/1024 < 5
3. 逻辑 / 集合操作符(重点)
and 交集
两边都存在才保留
promql
# CPU高 且 内存高 的节点
(cpu_usage > 80) and (mem_usage > 80)


or 并集
只要一边满足就保留
# CPU高 或 内存高
(cpu_usage > 80) or (mem_usage > 80)

unless 补集
左边有、右边没有才保留
# 有CPU指标 但 没有告警规则的节点
node_cpu_seconds_total unless alertmanager_alerts
4. 向量匹配操作符(一对一 / 多对多)
4.1 一对一匹配 on / ignoring
on(label_list):只按指定标签匹配
ignoring(label_list):忽略指定标签再匹配
# 示例 1:计算节点 CPU 使用率
# 步骤1:计算CPU空闲率(每个mode标签不同,直接运算会匹配失败)
rate(node_cpu_seconds_total{mode="idle"}[5m])
# 步骤2:用 ignoring 忽略 mode 标签,实现一对一匹配
(1 - avg(rate(node_cpu_seconds_total{mode="idle"}[5m])) by (instance)) * 100
4.2 多对多匹配
当一个向量的时间序列需要与另一个向量的多条序列匹配时,必须显式声明匹配方向:PromQL常用函数
速率计算类(Count指标必用)
用于计算计数器(如请求数、CPU 时间)的变化率,是 Prometheus 最核心的函数。
| 函数 | 作用 | 示例 |
|---|---|---|
rate(v range-vector) | 计算时间窗口内的平均每秒增长率,适合趋势分析 | rate(container_cpu_usage_seconds_total[5m]) |
irate(v range-vector) | 基于窗口内最后两个数据点计算瞬时速率,适合快速变化的指标 | irate(container_cpu_usage_seconds_total[5m]) |
increase(v range-vector) | 计算时间窗口内的总增量 | increase(http_requests_total[1h]) |
示例:容器 CPU 使用率
# 先算每个容器的CPU使用率,再按Pod聚合
sum(rate(container_cpu_usage_seconds_total[5m])) by (pod, namespace)
/ on(pod, namespace) group_left()
sum(container_spec_cpu_quota) by (pod, namespace)
聚合统计类(Gauge指标使用)
用于对时间序列进行聚合计算,按标签分组统计。
| 函数 | 作用 | 示例 |
|---|---|---|
sum() | 求和,最常用 | sum(container_memory_working_set_bytes) by (pod, namespace) |
avg() | 平均值 | avg(node_cpu_seconds_total{mode="idle"}) by (instance) |
max() | 最大值 | max(container_memory_working_set_bytes) by (pod) |
min() | 最小值 | min(container_memory_working_set_bytes) by (pod) |
count() | 计数,统计序列数量 | count(kube_pod_info) by (namespace) |
示例:按命名空间统计 Pod 总内存
sum(container_memory_working_set_bytes{pod!=""}) by (namespace) / 1024 / 1024 / 1024
时间窗口聚合类(Over Time)
用于对范围向量进行聚合,获取一段时间内的统计值。
| 函数 | 作用 | 示例 |
|---|---|---|
avg_over_time(v range-vector) | 时间窗口内的平均值 | avg_over_time(container_memory_working_set_bytes[5m]) |
max_over_time(v range-vector) | 时间窗口内的最大值 | max_over_time(container_memory_working_set_bytes[1h]) |
min_over_time(v range-vector) | 时间窗口内的最小值 | min_over_time(container_memory_working_set_bytes[1h]) |
quantile_over_time(φ, v range-vector) | 时间窗口内的分位数(如 P95) | quantile_over_time(0.95, http_request_duration_seconds_bucket[5m]) |
示例:取最近 5 分钟里,所有采样点的平均内存
avg_over_time(container_memory_working_set_bytes{pod!=""}[5m])
标签修改类
用于修改、添加或删除指标标签,解决匹配问题。
| 函数 | 作用 | 示例 |
|---|---|---|
label_replace() | 正则替换标签值,新增 / 修改标签 | label_replace(kube_pod_info, "app", "$1", "pod", "(.*)-.*") |
label_join() | 合并多个标签值为新标签 | label_join(kube_pod_info, "pod_full", "-", ["namespace", "pod"]) |
示例:从 Pod 名称中提取 Deployment 名称
label_replace(
  sum(container_memory_working_set_bytes{pod!=""}) by (pod, namespace),
  "deployment", "$1", "pod", "(.+)-[a-z0-9]+-[a-z0-9]+"
)
数据计算类
用于数值转换、单位换算和简单计算。
| 函数 | 作用 | 示例 |
|---|---|---|
abs() | 绝对值 | abs(node_load1 - node_load5) |
floor() / ceil() | 向下 / 向上取整 | floor(container_memory_working_set_bytes / 1024 / 1024) |
round() | 四舍五入 | round(container_memory_working_set_bytes / 1024 / 1024) |
clamp(v, min, max) | 限制数值范围 | clamp(node_load1, 0, 10) |
示例:内存单位转换(字节→GB,保留 2 位小数)
round(
  sum(container_memory_working_set_bytes{pod!=""}) by (pod, namespace) / 1024 / 1024 / 1024 * 100
) / 100
布尔过滤类
用于条件判断和序列过滤。
| 函数 | 作用 | 示例 |
|---|---|---|
bool | 把比较结果转为 0/1 | (node_load1 > 5) bool |
topk(n, vector) | 取 Top N 个序列 | topk(5, sum(container_memory_working_set_bytes) by (pod)) |
bottomk(n, vector) | 取 Bottom N 个序列 | bottomk(5, sum(container_memory_working_set_bytes) by (pod)) |
示例:找出内存使用 Top 5 的 Pod
topk(5,
  sum(container_memory_working_set_bytes{pod!=""}) by (pod, namespace) / 1024 / 1024
)
9、Alertmanager告警
Prometheus 只负责产生告警规则,判定有没有告警;
Alertmanager 专门负责统一接收 Prometheus 发过来的告警,做:
- 分组
- 抑制
- 静默
- 路由分发
- 发送通知(钉钉 / 企业微信 / 邮件 / 短信)
Alertmanager核心四大功能
| 功能 | 英文 | 作用 | 通俗理解 |
|---|---|---|---|
| 分组 | Grouping | 将同一时刻、同一类型的多条告警合并为一条推送,避免轰炸刷屏 | 一堆告警打包成一条,不一条条乱发 |
| 路由 | Routing | 根据告警标签,把不同告警分给不同接收组 / 渠道 | 磁盘告警给运维,业务告警给开发 |
| 抑制 | Inhibition | 产生根因告警后,自动抑制衍生关联告警 | 节点宕机,下面所有 Pod 告警自动静音 |
| 静默 | Silence | 手动临时屏蔽指定告警,维护期间不推送,到期自动解除 | 停机维护临时关告警,不用删规则 |
Alertmanager配置文件解析
Alertmanager 的配置文件(通常是 alertmanager.yml)主要由 4 大核心模块 组成:
- global 全局配置
- route 告警路由与分组
- receivers 告警接收人
- inhibit_rules 告警抑制规则
Global全局配置
定义所有通知渠道的通用参数,比如 SMTP 邮箱配置、通知超时、代理设置等。
global:
  # 钉钉/企业微信等通知的代理(可选)
  proxy_url: ""
  # 通知发送超时时间
  resolve_timeout: 5m
  # 邮箱告警配置(可选)
  smtp_from: "alert@example.com"
  smtp_smarthost: "smtp.example.com:587"
  smtp_auth_username: "alert@example.com"
  smtp_auth_password: "xxx"
  smtp_require_tls: false
route 告警路由与分组(核心)
决定告警如何分组、如何路由到不同接收人。
route:
  # 按哪些标签分组告警
  group_by: ['alertname', 'namespace', 'severity']
  # 等待多久再发送同组告警(给同组告警攒一波,避免刷屏)
  group_wait: 10s
  # 同一组告警,下一次发送的间隔
  group_interval: 5m
  # 告警未恢复时,多久重复发送一次
  repeat_interval: 4h
  # 默认接收人
  receiver: 'dingtalk-receiver'
  # 子路由(按标签匹配不同接收人)
  routes:
  - matchers:
    - severity = "critical"
    receiver: 'dingtalk-receiver'
  - matchers:
    - severity = "warning"
receiver: 'wechat-receiver'- group_by:最关键,按 alertname(告警名)、namespace(命名空间)、severity(级别)分组,避免同一类告警重复发送。
- routes:子路由,通过 matchers 匹配告警标签,将不同级别的告警发给不同渠道。
receivers 告警接收人
定义具体的通知渠道,支持钉钉、企业微信、邮件、Slack 等。
示例 1:钉钉接收人(最常用)
receivers:
- name: 'dingtalk-receiver'
  webhook_configs:
  - url: 'https://oapi.dingtalk.com/robot/send?access_token=你的token'
    send_resolved: true  # 告警恢复时也发送通知


示例 2:企业微信接收人
receivers:
- name: 'wechat-receiver'
  wechat_configs:
  - api_url: 'https://qyapi.weixin.qq.com/cgi-bin/message/send?access_token='
    corp_id: '你的企业ID'
    agent_id: 1000002
    to_user: '@all'
    send_resolved: true
inhibit_rules 告警抑制规则
定义根因告警触发时,如何抑制关联的衍生告警,避免告警风暴。
示例:节点宕机时,抑制该节点上所有 Pod 的告警
yaml
inhibit_rules:
- source_match:
    alertname: 'NodeDown'
  target_match:
    alertname: 'PodDown'
equal: ['instance']- source_match:触发抑制的根因告警(节点宕机)
- target_match:被抑制的衍生告警(Pod 宕机)
- equal:匹配相同标签(instance),仅抑制同一节点上的 Pod 告警。
PrometheusRule报警规则
PrometheusRule 就是 Kubernetes 里用来定义「Prometheus 告警规则 + 记录规则」的官方 CRD(自定义资源)。
核心作用:
1、统一托管告警规则
在 K8s 中以 CRD 资源形式,定义各类监控告警触发规则(CPU、内存、磁盘、服务宕机等)。
2、预计算记录规则
把复杂 PromQL 提前聚合计算,提升查询、 Grafana 图表加载速度。
3、给 Alertmanager 提供告警源
规则触发产生告警,交给 Alertmanager 做分组、抑制、转发(邮件 / 钉钉)。
# 查看所有默认告警规则
[root@VM-17-171-tencentos ~]# kubectl get prometheusrules -n monitoring
NAME                              AGE
alertmanager-main-rules           6m53s
grafana-rules                     6m51s
kube-prometheus-rules             6m51s
kube-state-metrics-rules          6m51s
kubernetes-monitoring-rules       6m51s
node-exporter-rules               6m50s
prometheus-k8s-prometheus-rules   6m49s
prometheus-operator-rules         6m48s
163邮件告警实例
| 序号 | 准备项目 | 正确操作 |
|---|---|---|
| 1 | 发件邮箱 | 完整的 163 邮箱地址:xxx@163.com |
| 2 | 必须开启 | POP3/SMTP 服务 |
| 3 | 授权码 | 开启 POP3/SMTP 服务 后生成的客户端授权码 |
| 4 | SMTP 地址端口 | smtp.163.com:465 |
| 5 | 收件邮箱 | 接收告警的邮箱(QQ/163 / 企业邮箱均可) |
查看对应版本说明文档
首先查看文件我们kube-Prometheus的版本说明文档:
[root@VM-17-171-tencentos ~]# cat kube-prometheus-release-0.17/docs/customizations/alertmanager-configuration.md
### Alertmanager configuration

The Alertmanager configuration is located in the `values.alertmanager.config` configuration field. In order to set a custom Alertmanager configuration simply set this field.

```jsonnet mdox-exec="cat examples/alertmanager-config.jsonnet"
((import 'kube-prometheus/main.libsonnet') + {
   values+:: {
     alertmanager+: {
       config: |||
         global:
           resolve_timeout: 10m
         route:
           group_by: ['job']
           group_wait: 30s
           group_interval: 5m
           repeat_interval: 12h
           receiver: 'null'
           routes:
           - match:
               alertname: Watchdog
             receiver: 'null'
         receivers:
         - name: 'null'
       |||,
     },
   },
 }).alertmanager.secret
```

In the above example the configuration has been inlined, but can just as well be an external file imported in jsonnet via the `importstr` function.

```jsonnet mdox-exec="cat examples/alertmanager-config-external.jsonnet"
((import 'kube-prometheus/main.libsonnet') + {
   values+:: {
     alertmanager+: {
       config: importstr 'alertmanager-config.yaml',
     },
   },
 }).alertmanager.secret
配置Alertmanager配置
cat > alertmanager-config.yaml <<'EOF'
global:
  resolve_timeout: 10m
  smtp_smarthost: 'smtp.163.com:465'
  smtp_from: 'gwjcloud@163.com'
  smtp_auth_username: 'gwjcloud@163.com'
  smtp_auth_password: 'HTfZ7VddWhDkhrJz'
  smtp_require_tls: false

route:
  group_by: ['alertname']
  group_wait: 30s
  group_interval: 1m
  repeat_interval: 5m
  receiver: 'email'

receivers:
- name: 'email'
  email_configs:
  - to: 'guoweijiemail@163.com'
    send_resolved: true
    html: |
      {{ if eq .Status "firing" }}<h2 style="color:red">集群告警触发</h2>{{ end }}
      {{ if eq .Status "resolved" }}<h2 style="color:green">告警已恢复</h2>{{ end }}
      {{ range .Alerts }}
      <p><strong>告警名称:</strong>{{ .Labels.alertname }}</p>
      <p><strong>告警级别:</strong>{{ .Labels.severity }}</p>
      <p><strong>节点:</strong>{{ .Labels.instance }}</p>
      <p><strong>告警摘要:</strong>{{ .Annotations.summary }}</p>
      <p><strong>告警描述:</strong>{{ .Annotations.description }}</p>
      <p><strong>触发时间:</strong>{{ .StartsAt.Format "2006-01-02 15:04:05" }}</p>
      <hr>
      {{ end }}
EOF
写入标准的Jsonnet
cat > alertmanager-config-external.jsonnet <<'EOF'
((import 'jsonnet/kube-prometheus/main.libsonnet') + {
  values+:: {
    alertmanager+: {
      namespace: "monitoring",
      config: importstr 'alertmanager-config.yaml',
    },
  },
}).alertmanager.secret
EOF
生成secret文件
[root@VM-17-171-tencentos kube-prometheus-release-0.17]# jsonnet -J vendor -J jsonnet alertmanager-config-external.jsonnet -o alertmanager-secret.yaml
应用配置
[root@VM-17-171-tencentos kube-prometheus-release-0.17]# kubectl apply -f alertmanager-secret.yaml -n monitoring
查看Alertmanager界面
打开Alertmanager的界面查看配置是否加载上
# 修改alertmanager的service类型为NodePort
[root@VM-17-171-tencentos kube-prometheus-release-0.17]# kubectl edit svc -n monitoring  alertmanager-main
找到ClusterIP 改为 NodePort
打开Alertmanager的界面查看Status
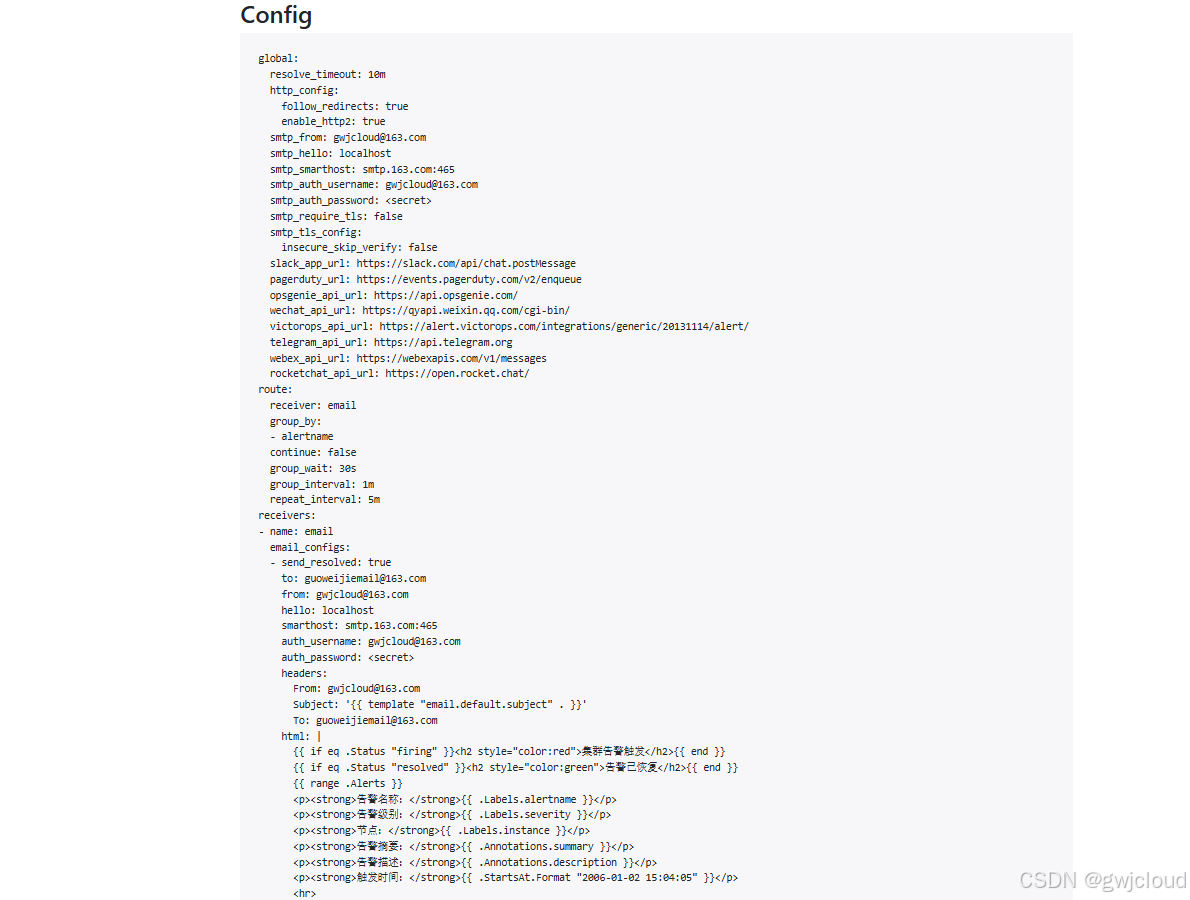
可以看到我们的邮箱信息已经有了
创建prometheusRule自定义告警策略
cat > prometheus-rule.yaml <<'EOF'
apiVersion: monitoring.coreos.com/v1
kind: PrometheusRule
metadata:
  name: pod-cpu-alert
  namespace: monitoring
spec:
  groups:
  - name: pod_cpu_alert
    rules:
    - alert: PodCPUHigh
      expr: sum(rate(container_cpu_usage_seconds_total{pod!="",container!="POD"}[1m])) by (namespace,pod) * 1000 > 10
      for: 30s
      labels:
        severity: warning
      annotations:
        summary: "Pod CPU使用率过高"
        description: "命名空间:{{$labels.namespace}} | Pod:{{$labels.pod}} | CPU:{{$value}}m"
EOF
# 应用
[root@VM-17-171-tencentos kube-prometheus-release-0.17]# kubectl apply -f prometheus-rule.yaml -n monitoring
# 查看创建的prometheusRule
[root@VM-17-171-tencentos kube-prometheus-release-0.17]# kubectl get prometheusrule -n monitoring
NAME AGE
alertmanager-main-rules 3h44m
grafana-rules 3h44m
kube-prometheus-rules 3h44m
kube-state-metrics-rules 3h44m
kubernetes-monitoring-rules 3h44m
node-exporter-rules 3h44m
pod-cpu-alert 17s
prometheus-k8s-prometheus-rules 3h44m
prometheus-operator-rules 3h44m
告警验证
# 查看pod cpu使用率
[root@VM-17-171-tencentos kube-prometheus-release-0.17]# kubectl top pod -n monitoring
NAME                                   CPU(cores)   MEMORY(bytes)
alertmanager-main-0                    2m           31Mi
alertmanager-main-1                    2m           29Mi
alertmanager-main-2                    1m           31Mi
blackbox-exporter-7fbddb9bfd-rdhqm     0m           24Mi
grafana-9cc954875-dqjw2                4m           126Mi
kube-state-metrics-7f8cfc5685-k597l    1m           44Mi
node-exporter-rv4nl                    2m           22Mi
prometheus-adapter-bd8f8cd5d-6tglb     2m           32Mi
prometheus-adapter-bd8f8cd5d-8r6fm     2m           32Mi
prometheus-k8s-0                       16m          574Mi
prometheus-k8s-1                       10m          551Mi
prometheus-operator-84677856f9-hghq4   0m           32Mi
等待邮件收到报警
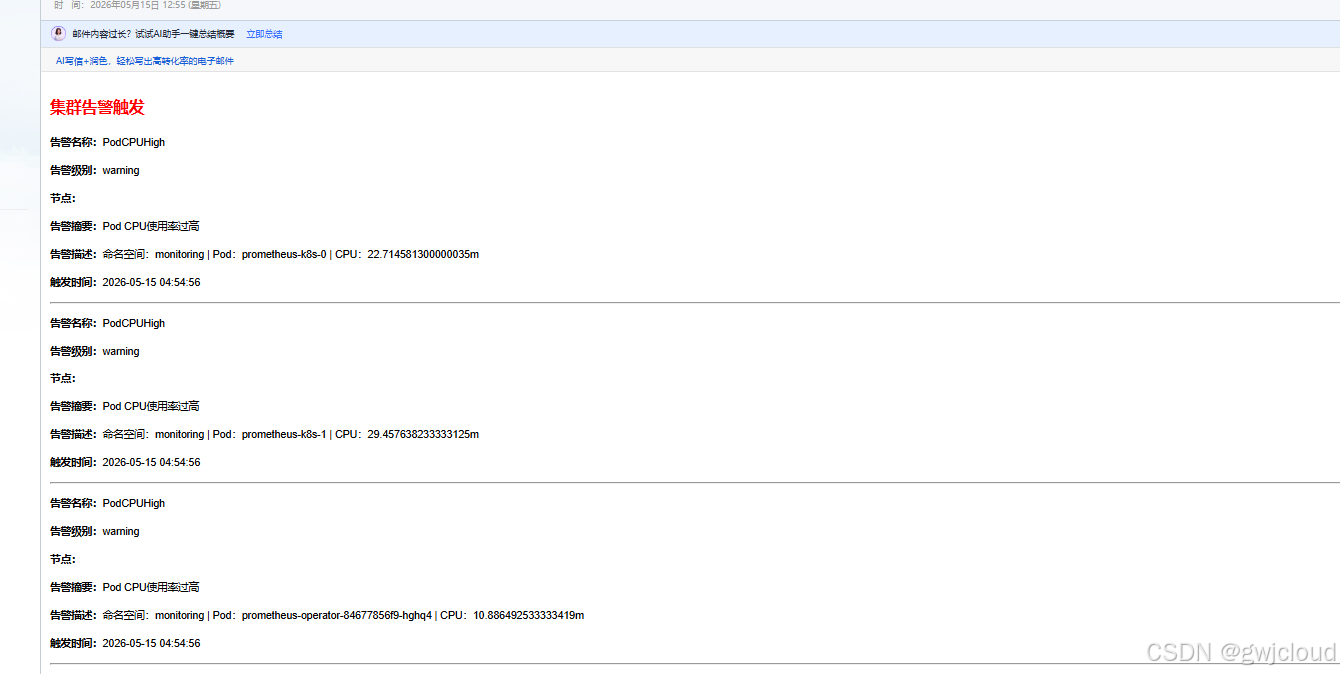
等待一会cpu 的使用率会下去
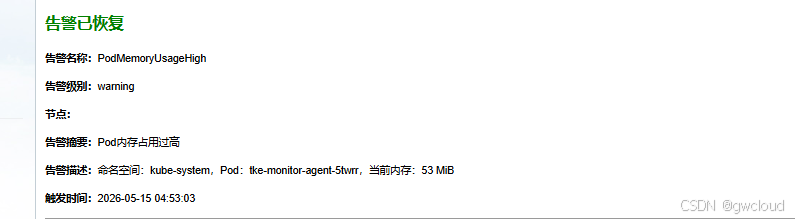
10、补充说明
计划只能暂停告警 / 关闭告警
默认有好几条告警规则,在上面自定义配置告警规则的时候,我们邮箱中间收到好多自带的告警

把不需要的告警屏蔽
打开Alertmanager的界面,查看所有的告警都有什么
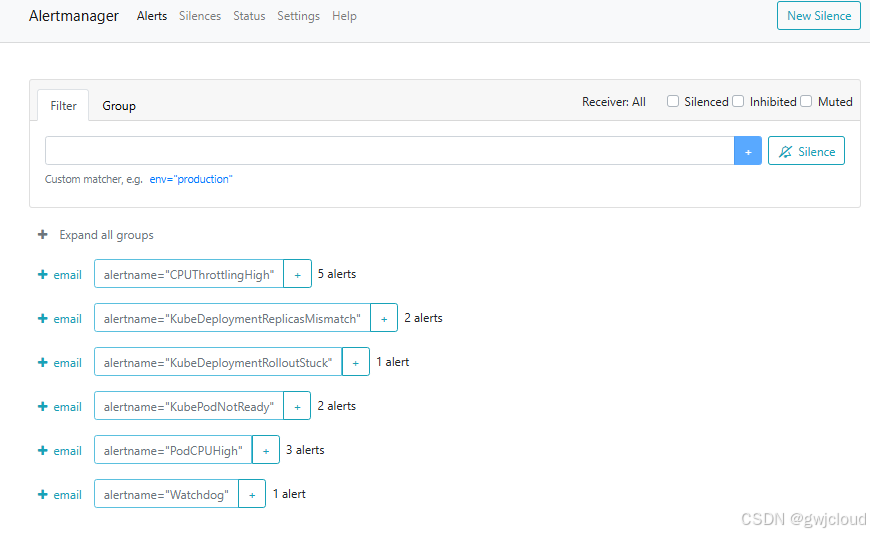
# 可安全屏蔽的告警
CPUThrottlingHigh  # 这是容器CPU被内核限流的告警。
Watchdog           # 这是 Prometheus 自带的 “心跳 / 看门狗告警”  它本身 不是故障告警,只是个 “我还活着” 的信号。
# 不可屏蔽的
KubeDeploymentReplicasMismatch # 望副本数(replicas) 和 实际运行的就绪副本数 不一致。
KubeDeploymentRolloutStuck # Deployment 的滚动更新卡住了
KubePodNotReady # 集群中有 Pod 没有进入 Ready 状态
PodCPUHigh # 自定义的报警,在工作中使用肯定是不能屏蔽的关闭可以屏蔽的告警
点击右上角 New Silence 新建静默规则
# 需要关闭的告警
alertname=~"CPUThrottlingHigh|Watchdog"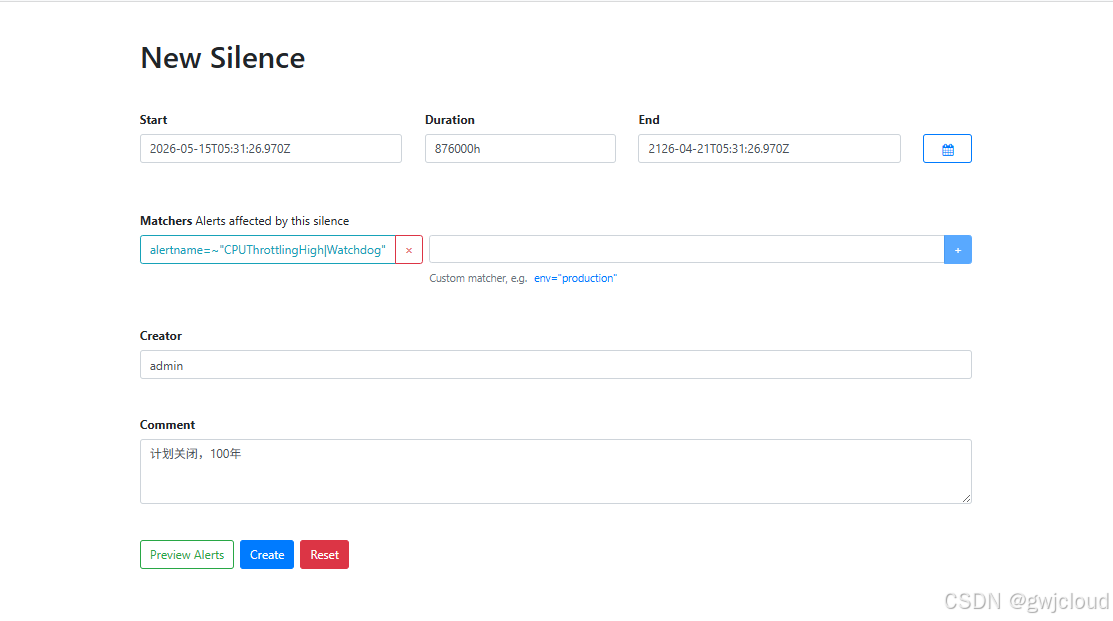
查看已经关闭的策略
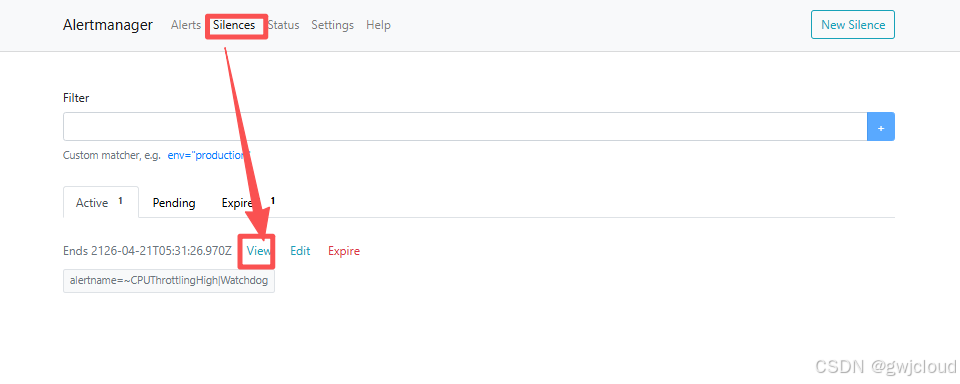
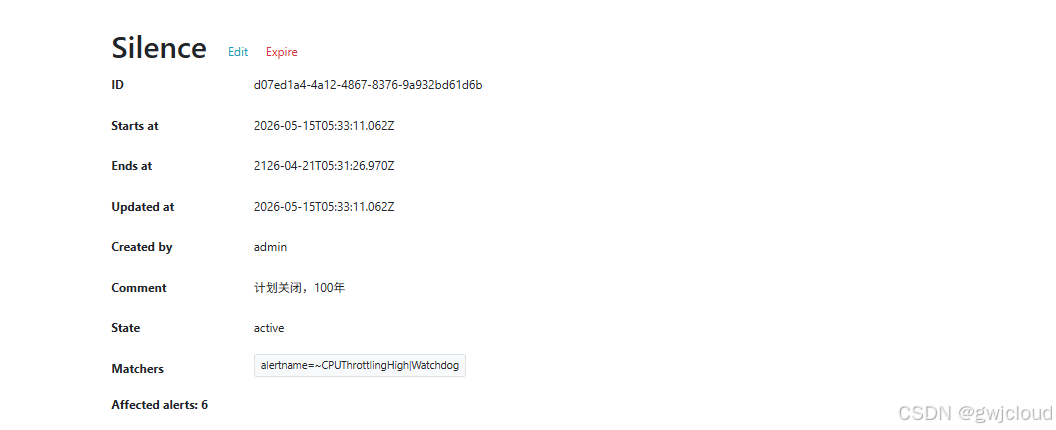
当然也可以直接在集群中删除对应的PrometheusRule,但是不推荐
Grafana数据持久化
当前的 Grafana Pod 是无持久化的临时存储,重启 / 重建后仪表盘、数据源、用户配置会全部丢失
Grafana 优先用 块存储;中小型集群也可以用文件存储,都能用,但首选块。
# 查看StorageClass
[root@VM-17-171-tencentos ~]# kubectl get sc -A
NAME            PROVISIONER                 RECLAIMPOLICY   VOLUMEBINDINGMODE   ALLOWVOLUMEEXPANSION   AGE
cbs (default)   com.tencent.cloud.csi.cbs   Delete          Immediate           false                  4h49m
这是腾讯TKE的默认的StorageClass,在生产中使用替换为真实的StorageClass
# 创建pvc
[root@VM-17-171-tencentos ~]# vim grafana-pvc.yaml
apiVersion: v1
kind: PersistentVolumeClaim
metadata:
name: grafana-data
namespace: monitoring
spec:
storageClassName: cbs # 指定腾讯云 CBS 块存储
accessModes:
- ReadWriteOnce # Grafana 单副本必须用这个
resources:
requests:
storage: 10Gi # apply
[root@VM-17-171-tencentos ~]# kubectl apply -f grafana-pvc.yaml
# 查看
[root@VM-17-171-tencentos ~]# kubectl get pvc -n monitoring
NAME STATUS VOLUME CAPACITY ACCESS MODES STORAGECLASS VOLUMEATTRIBUTESCLASS AGE
grafana-data Bound pvc-fa75df1a-f003-4a1c-81fb-5e57ce400ca1 10Gi RWO cbs <unset> 15s
# 给 Grafana 挂载
[root@VM-17-171-tencentos ~]# kubectl edit deployment grafana -n monitoring
找到volumes下的这一段
      - emptyDir: {}
        name: grafana-storage
修改为
      - name: grafana-storage
        persistentVolumeClaim:
          claimName: grafana-data

替换完效果
volumes:
- name: grafana-storage
  persistentVolumeClaim:
    claimName: grafana-data
- name: grafana-datasources
  secret:
    defaultMode: 420
    secretName: grafana-datasources
- configMap:
    defaultMode: 420
    name: grafana-dashboards
  name: grafana-dashboards
...后面全部不动...
测试数据持久化
登录Grafana页面输入账号密码,并修改
# 删除Grafana pod 重建看数据是否还存在
[root@VM-17-171-tencentos ~]# kubectl delete pod -n monitoring grafana-59cd44fbff-xtd7f
重新登录Grafana界面,修改账号和修改后的密码,可以登录,持久化成功。
三、Ingress服务进阶
Ingress 就是 K8s 集群的统一入口网关,负责把外部网络请求,转发到集群内部各个 Service 服务。
官网:https://kubernetes.github.io/ingress-nginx/user-guide/nginx-configuration/annotations/
基本概念使用 我们在《kubernetes从入门到精通(基础篇)02》介绍过
https://blog.csdn.net/Mrguo007/article/details/160369608?spm=1011.2415.3001.5331
1、Ingress服务发布架构
外网用户
    │
    ▼
域名DNS解析
    │
    ▼
云负载均衡LB / 公网入口
    │
    ▼
─────────────────
│ Ingress Controller 集群 │ 多副本、跨节点高可用(内网负载均衡)
─────────────────
    │
    ▼
Ingress 路由规则匹配(域名/路径)
    │
    ▼
K8s Service(ClusterIP)
    │
    ▼
业务Pod 多副本
Ingress 和 Ingress Controller 核心区别
Ingress
- 是 K8s 资源对象(YAML 写的配置)
- 只负责定义路由规则
- 作用:域名、路径、转发给谁、HTTPS 证书
- 可以比如成nginx的配置文件(nginx.conf)
Ingress Controller
- 是 真正运行的 Pod(Nginx/Traefik)
- 是实际接收流量、转发请求的网关
- 作用:监听 80/443,加载 Ingress 规则,代理流量
- 可以比喻成nginx服务
2、Ingress Controller生产高可用架构
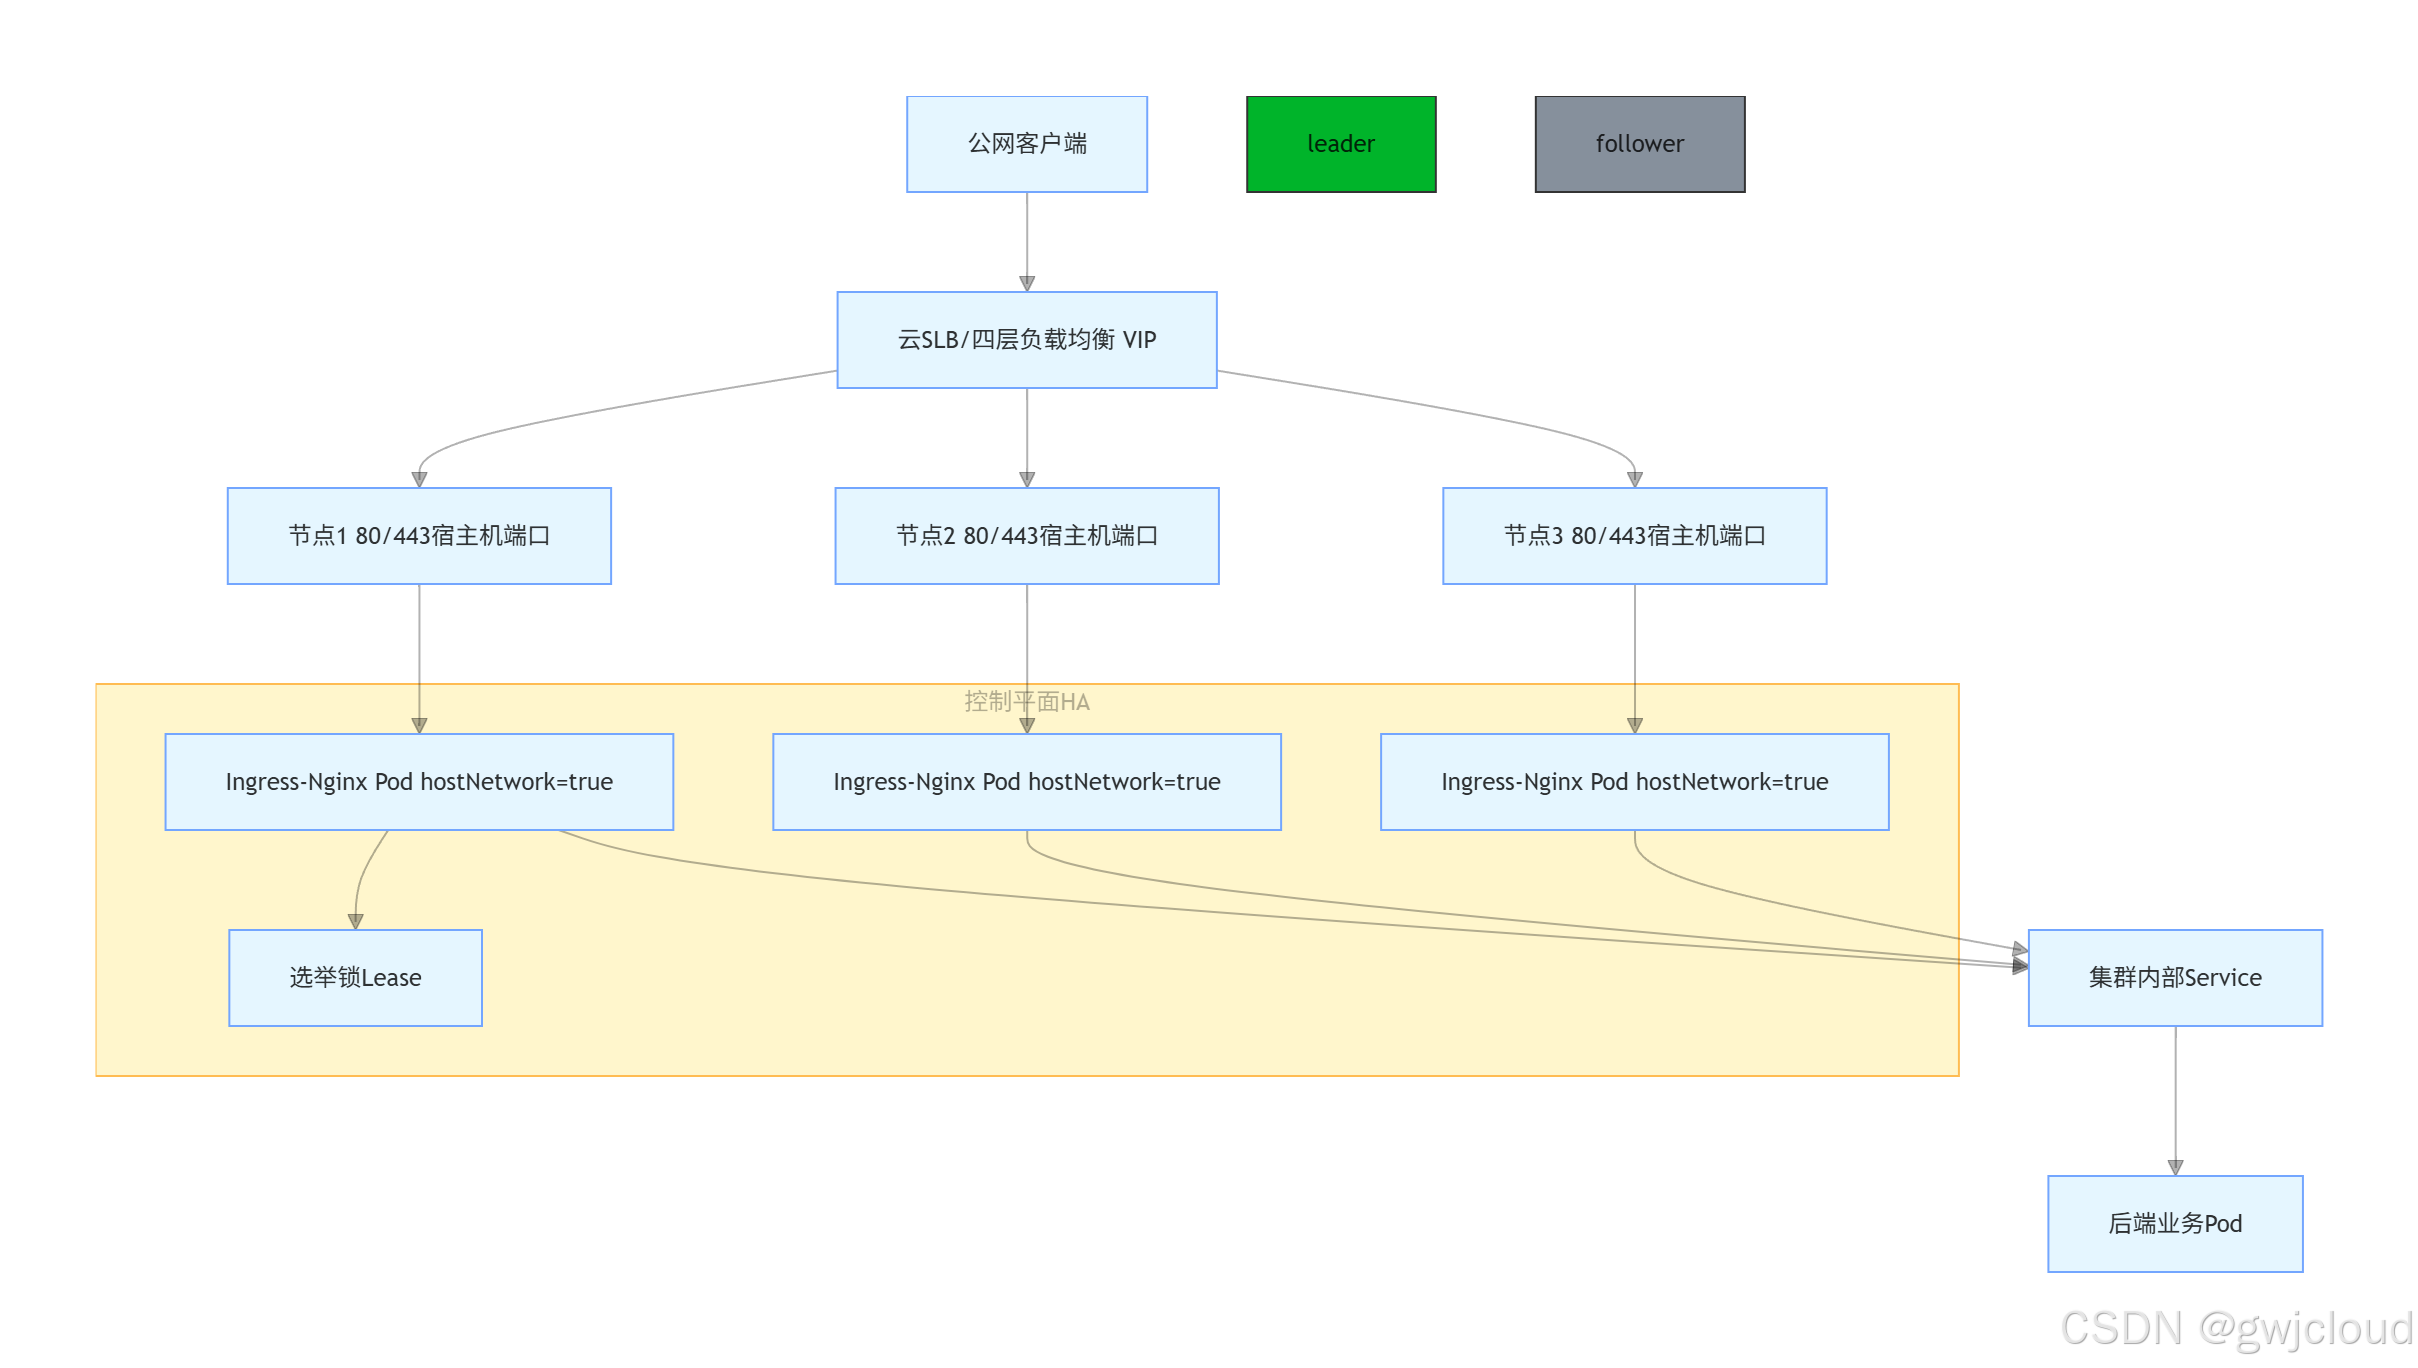
架构数据流
1、外网流量统一接入SLB四层转发,轮询分发到所有部署Ingress Controller节点宿主机的80/443端口
2、Ingress Pod使用hostNetwork:true直接绑定宿主机端口,绕过k8s Service转发
3、所有Ingress Controller实例流量同时承接,仅Leader节点负责监听Ingress资源,生成nginx配置、热重载
4、Leader宕机自动重新选举,流量转发全程不中断
5、Ingress转发请求至集群内的Service,最终到达业务Pod
核心特性说明:
1、部署方式 :DaemonSet
- 集群每个指定节点自动运行1个ingress-nginx pod
- 支持节点标签筛选,只在专属网关节点部署,不占业务节点资源
- 新增网关节点自动拉起Ingress,缩容节点自动销毁,天然弹性
2、网络模式:hostNetwork:true
- pod共享宿主机网络命名空间,直接监听宿主机80、443端口
- 消除CNI网络转发开销,延迟最低,吞吐最高
- 通过集群内部的ClusterIP转发到业务pod
- 天然保留真实客户端源ip
3、高可用三大机制
1)Leader选举(控制平面高可用)
- 启动参数开启选主:--election-id=ingress-controller-leader
- 集群内部仅一个Leader
- 其余Follower节点:只转发流量,不做配置变更
- 故障切换:Leader异常失联,30s内重新选举新主,业务流量无终端
2)pod调度隔离(故障域隔离)
- 节点亲和:Ingress只调度到专属网关节点
- pod 反亲和:杜绝同一节点运行多个Ingress实例
- 多可用区部署:网关节点打散在不用AZ,实现单AZ容灾
3)双重健康检查
- 容器内置探针:/healthz健康接口,k8s自动重启异常pod
- SLB外层健康检查:SLB探测节点/healthz,自动摘除故障节点流量
3、安装Ingress Controller高可用架构
《kubernetes从入门到精通(基础篇)02》已经安装过ingress 实例
https://blog.csdn.net/Mrguo007/article/details/160369608?spm=1011.2415.3001.5331
# 查看之前安装的ingress
[root@k8s-master01 ~]# helm list -n ingress-nginx
NAME         	NAMESPACE    	REVISION	UPDATED                                	STATUS  	CHART               	APP VERSION
ingress-nginx	ingress-nginx	2       	2026-04-25 17:46:55.655750635 +0800 CST	deployed	ingress-nginx-4.15.1	1.15.1
# 其实我们现在的Ingress Controller就是一个高可用的架构,只是副本是1个只有master01上有标签
# 给master02 master03 节点打标签ingress=true,ingress Controller就能自动部署上去
[root@k8s-master01 ~]# kubectl label node k8s-master02 ingress=true
[root@k8s-master01 ~]# kubectl label node k8s-master03 ingress=true

# 查看Ingress Controller
[root@k8s-master01 ~]# kubectl get pod -n ingress-nginx
NAME                             READY   STATUS    RESTARTS   AGE
ingress-nginx-controller-887ff   1/1     Running   0          18s
ingress-nginx-controller-gn9tx   1/1     Running   0          2m13s
ingress-nginx-controller-lhl4b   1/1     Running   0          2m10s

# 查看那个Ingress Controller是Leader
[root@k8s-master01 ~]# kubectl get lease -n ingress-nginx
NAME                   HOLDER                           AGE
ingress-nginx-leader   ingress-nginx-controller-lhl4b   20d
说明:这里的20d 是这个锁是20天前创建的 不会跟随pod的时间去更新
# 生成测试用例
# deployment
[root@k8s-master01 nginx-ingress]# cat vue-deployment.yaml
apiVersion: apps/v1
kind: Deployment
metadata:
name: vue-login-pod
namespace: tcloud
spec:
replicas: 3
selector:
matchLabels:
app: nginx-pod
template:
metadata:
labels:
app: nginx-pod
spec:
containers:
- name: vue-login
image: registry.cn-hangzhou.aliyuncs.com/gwjcloud/vue-login:v1.0
imagePullPolicy: IfNotPresent
ports:
- containerPort: 80
# service
[root@k8s-master01 nginx-ingress]# cat vue-service.yaml
apiVersion: v1
kind: Service
metadata:
name: vue-login-service
namespace: tcloud
spec:
selector:
app: nginx-pod
ports:
- port: 80
targetPort: 80
type: ClusterIP
# ingress
[root@k8s-master01 nginx-ingress]# cat vue-ingress.yaml
apiVersion: networking.k8s.io/v1
kind: Ingress
metadata:
name: vue-login-ingress
namespace: tcloud
spec:
ingressClassName: nginx
rules:
- host: www.tcloud.com
http:
paths:
- path: /
pathType: Prefix
backend:
service:
name: vue-login-service
port:
number: 80
[root@k8s-master01 nginx-ingress]# kubectl apply -f .
在本地hosts添加解析
192.168.1.100 www.tcloud.com
4、Ingress permanent-redirect 域名重定向
公司业务正式更换对外域名,不能一刀切直接下线旧域名:
- 用户浏览器收藏夹、桌面快捷访问、小程序内置旧域名、外部合作方对接地址全是老域名
- 客户端缓存、线下物料印刷、推广外链无法立刻全部修改
- 需要漫长过渡期平稳引流,逐步引导用户使用新域名,最终淘汰旧域名
官网说明文档:
https://kubernetes.github.io/ingress-nginx/user-guide/nginx-configuration/annotations/#rewritehttps://kubernetes.github.io/ingress-nginx/user-guide/nginx-configuration/annotations/#permanent-redirecthttps://kubernetes.github.io/ingress-nginx/user-guide/nginx-configuration/annotations/#rewrite
核心参数:
annotations:
  nginx.ingress.kubernetes.io/permanent-redirect: "https://新域名.com"
# 编辑ingress文件 新域名:www.wcloud.com
[root@k8s-master01 nginx-ingress]# vim vue-ingress.yaml
apiVersion: networking.k8s.io/v1
kind: Ingress
metadata:
name: vue-login-ingress
namespace: tcloud
# 添加以下内容
annotations:
nginx.ingress.kubernetes.io/permanent-redirect: "https://www.wcloud.com"
spec:
ingressClassName: nginx
rules:
- host: www.tcloud.com
http:
paths:
- path: /
pathType: Prefix
backend:
service:
name: vue-login-service
port:
number: 80
# apply生效
[root@k8s-master01 nginx-ingress]# kubectl apply -f vue-ingress.yaml

# 本地测试
# 指定请求头域名访问 ingress IP 这里是VIP
[root@k8s-master01 nginx-ingress]# curl -H "Host:www.tcloud.com" 192.168.1.100
<html>
<head><title>301 Moved Permanently</title></head>
<body>
<center><h1>301 Moved Permanently</h1></center>
<hr><center>nginx</center>
</body>
</html>
可以看见是301从重定向了

# 看以下重定向哪里 是新域名www.wcloud.com
[root@k8s-master01 nginx-ingress]# curl -H "Host:www.tcloud.com" 192.168.1.100 -I
HTTP/1.1 301 Moved Permanently
Date: Sat, 16 May 2026 05:07:03 GMT
Content-Type: text/html
Content-Length: 162
Connection: keep-alive
Location: https://www.wcloud.com
添加hosts文件
192.168.1.100 www.tcloud.com www.wcloud.com
访问www.tcloud.com(旧域名)
可以发现跳转到了新域名www.wcloud.com 404是因为我们这个域名没有真实的地址,没有访问到任何资源
5、Ingress Permanent Redirect Code 永久重定向状态码
更改重定向码 301 为 308
- 301:永久重定向,请求方法会变,POST 会自动改成 GET,丢失请求体数据
- 308:永久重定向,保持原请求方法不变,POST/ PUT 跳转后依旧保留原请求方式与数据
使用场景:
- 纯页面跳转、静态访问 → 用 301
- 接口转发、需要保留 POST 提交数据 → 必须用 308
核心配置
nginx.ingress.kubernetes.io/permanent-redirect-code: '308'
[root@k8s-master01 nginx-ingress]# vim vue-ingress.yaml
apiVersion: networking.k8s.io/v1
kind: Ingress
metadata:
name: vue-login-ingress
namespace: tcloud
annotations:
nginx.ingress.kubernetes.io/permanent-redirect: "https://www.wcloud.com"
# 添加这里
nginx.ingress.kubernetes.io/permanent-redirect-code: "308"
spec:
ingressClassName: nginx
rules:
- host: www.tcloud.com
http:
paths:
- path: /
pathType: Prefix
backend:
service:
name: vue-login-service
port:
number: 80
# 更新ingress
[root@k8s-master01 nginx-ingress]# kubectl replace -f vue-ingress.yaml
# 访问测试  可以看到是308了
[root@k8s-master01 nginx-ingress]# curl -H "Host:www.tcloud.com" 192.168.1.100
<html>
<head><title>308 Permanent Redirect</title></head>
<body>
<center><h1>308 Permanent Redirect</h1></center>
<hr><center>nginx</center>
</body>
</html>
6、Ingress Rewrite 前后端分离
实验环境:
文章《Kubernetes部署Spring Boot项目》https://blog.csdn.net/Mrguo007/article/details/161147114?spm=1011.2415.3001.5331
假设业务系统是这样的
- 前端是 Vue,部署在 frontend-service:80,所有静态资源都挂在根路径 /。
- 后端是 SpringBoot,部署在 backend-service:8080,接口本身不带前缀,比如真实接口是 /user/login、/book/list。
- 前端代码里,所有接口请求都约定了加 /api/ 前缀,比如实际调用时会发 /api/user/login、/api/book/list。
- 对外统一用 Nginx Ingress 做入口
问题:不配置 Rewrite 会怎样?
# Ingress 这样写:
paths:
  - path: /api/
    pathType: Prefix
    backend:
      service:
        name: backend-service
        port:
          number: 8080
  - path: /
    pathType: Prefix
    backend:
      service:
        name: frontend-service
        port:
          number: 80

请求流程:
1.前端发 GET /api/user/info
2.Ingress 匹配 /api/,直接转发给后端
3.后端收到的请求路径是 /api/user/info
4.但后端的接口是 /user/info,所以返回 404 Not Found官网说明:https://kubernetes.github.io/ingress-nginx/user-guide/nginx-configuration/annotations/#rewrite
先来个没有Rewrite的配置,先把frontend-service的service类型修改为ClusterIP略
但是我们的后端代码是有api前缀的
[root@k8s-master01 diagramhub]# vim error-ingress.yaml
apiVersion: networking.k8s.io/v1
kind: Ingress
metadata:
  name: diagramhub-ingress
  namespace: diagramhub
spec:
  ingressClassName: nginx
  rules:
    - http:
        paths:
          - path: /api
            pathType: Prefix
            backend:
              service:
                name: backend-service
                port:
                  number: 8080
          - path: /
            pathType: Prefix
            backend:
              service:
                name: frontend-service
                port:
                  number: 80

# 部署
[root@k8s-master01 diagramhub]# kubectl apply -f error-ingress.yaml
所以说我们这样配置也是能够正常转发请求的,没有404,因为代码是通过AI写的,都带上API,正常大部分代码都不带API,就需要通过Rewrite来转发,所以现在是可以正常访问,也没有404
假如你的后端代码 没有 /api 前缀
# 例如
@RestController
@RequestMapping("/books")  // 这里没有 /api
public class BookController {
}

接口真实路径是:/books、/book/count
这种场景 → 必须配置 Rewrite
[root@k8s-master01 diagramhub]# cat ingress.yaml
# Kubernetes Ingress 配置 V1 版本(K8s 标准最新版本)
apiVersion: networking.k8s.io/v1
kind: Ingress

# 资源名称与命名空间
metadata:
  name: diagramhub-ingress
  namespace: diagramhub

  # ==================== 核心重要配置:Rewrite 路径重写 ====================
  # 【重要】开启正则表达式匹配,必须开启才能使用路径重写
  nginx.ingress.kubernetes.io/use-regex: "true"

  # 【重要】路径重写规则:将 /api/xxx 自动重写为 /xxx
  # 作用:去掉前端传入的 /api 前缀,适配后端无 /api 前缀的接口
  nginx.ingress.kubernetes.io/rewrite-target: /$2
  # ======================================================================

spec:
  # 【重要】指定 Ingress 控制器名称,集群查询命令:kubectl get ingressclasses
  ingressClassName: nginx

  # 域名规则配置
  rules:
    - host: www.wcloud.com  # 业务访问域名
      http:
        paths:
          # ==================== 后端 API 路由 ====================
          # 【重要】正则路径:匹配所有 /api 开头的请求
          # 场景:前端调用 /api/books,会被重写为 /books 转发给后端
          - path: /api(/|$)(.*)
            pathType: Prefix
            backend:
              service:
                # 后端 Service 名称(与你的环境完全一致)
                name: backend-service
                port:
                  # 后端服务端口
                  number: 8080

          # ==================== 前端页面路由 ====================
          # 匹配根路径 /,所有页面访问走前端
          - path: /
            pathType: Prefix
            backend:
              service:
                # 前端 Service 名称
                name: frontend-service
                port:
                  # 前端服务端口
                  number: 80
这样配置才能正常转发到后端服务。
7、Ingress 区分手机端和PC端
很多系统在设计的时候都有PC端和手机端,在访问的时候是请求头带的我们访问设备的信息
就是通过这个来进行的区分
所以ingress就可以这样去写
apiVersion: networking.k8s.io/v1
kind: Ingress
metadata:
  name: diagramhub-ingress
  namespace: diagramhub
  annotations:
    nginx.ingress.kubernetes.io/server-snippet: |
      set $agentflag 0;

      if ($http_user_agent ~* "(Mobile|Android|iPhone|iPad)") {
        set $agentflag 1;
      }

      if ($agentflag = 1) {
        return 302 http://《这里填写手机端端业务的域名》;
      }
spec:
  ingressClassName: nginx
  rules:
    - host: www.wcloud.com
      http:
        paths:
          - path: /api/
            pathType: Prefix
            backend:
              service:
                name: backend-service
                port:
                  number: 8080
          - path: /
            pathType: Prefix
            backend:
              service:
                name: frontend-service
                port:
                  number: 80
这边没有移动端的业务pod,所以就不去验证了
8、Ingress 添加账号密码
Ingress 加账号密码(Basic Auth)核心场景:对外暴露但不想公开、应用本身无认证、临时 / 轻量授权、内部工具与敏感管理界面防护。
官方文档:https://kubernetes.github.io/ingress-nginx/examples/auth/basic/
# 下载工具 生成加密密码
[root@k8s-master01 diagramhub]# yum install -y httpd-tools

[root@k8s-master01 nginx-ingress]# htpasswd -c auth gwjcloud
New password:
Re-type new password:
Adding password for user gwjcloud
[root@k8s-master01 nginx-ingress]# cat auth
gwjcloud:$apr1$fqknscH3$Q6YYXyQgEJfcjIyhNZJPi1


# 基于auth文件创建secret
[root@k8s-master01 nginx-ingress]# kubectl create secret generic basic-auth --from-file=auth -n tcloud
# 修改ingress 添加
apiVersion: networking.k8s.io/v1
kind: Ingress
metadata:
  name: vue-login-ingress
  namespace: tcloud
  annotations:
    nginx.ingress.kubernetes.io/auth-type: basic
    nginx.ingress.kubernetes.io/auth-secret: basic-auth
    nginx.ingress.kubernetes.io/auth-realm: "Auth Required"
spec:
  ingressClassName: nginx
  rules:
  - host: www.tcloud.com
    http:
      paths:
      - path: /
        pathType: Prefix
        backend:
          service:
            name: vue-login-service
            port:
              number: 80
[root@k8s-master01 nginx-ingress]# kubectl replace -f vue-ingress.yaml
访问测试
输出正确的账号密码就可以在进入到主页面。
9、Ingress 配置黑白名单
黑名单
黑名单:拒绝指定IP,其他的都允许
# 添加黑名单
[root@k8s-master01 nginx-ingress]# vim vue-ingress.yaml
[root@k8s-master01 nginx-ingress]# cat vue-ingress.yaml
apiVersion: networking.k8s.io/v1
kind: Ingress
metadata:
  name: vue-login-ingress
  namespace: tcloud
  annotations:
     # 黑名单:拒绝这些IP
    nginx.ingress.kubernetes.io/denylist-source-range: "192.168.1.1,114.114.114.114"
spec:
  ingressClassName: nginx
  rules:
  - host: www.tcloud.com
    http:
      paths:
      - path: /
        pathType: Prefix
        backend:
          service:
            name: vue-login-service
            port:
              number: 80
我宿主机的ip是192.168.1.1 去访问

# 换别的IP去访问测试
[root@k8s-master01 nginx-ingress]# curl -H "Host: www.tcloud.com" http://192.168.1.100 -I
HTTP/1.1 200 OK
Date: Tue, 19 May 2026 06:25:41 GMT
Content-Type: text/html
Content-Length: 403
Connection: keep-alive
Last-Modified: Sat, 11 Apr 2026 10:06:20 GMT
ETag: "69da1d1c-193"
Accept-Ranges: bytes
白名单
允许指定的IP访问,剩下的都拒绝
[root@k8s-master01 nginx-ingress]# vim vue-ingress.yaml
[root@k8s-master01 nginx-ingress]# cat vue-ingress.yaml
apiVersion: networking.k8s.io/v1
kind: Ingress
metadata:
  name: vue-login-ingress
  namespace: tcloud
  annotations:
     # 白名单:允许这些Ip
    nginx.ingress.kubernetes.io/whitelist-source-range: "192.168.1.1"
spec:
  ingressClassName: nginx
  rules:
  - host: www.tcloud.com
    http:
      paths:
      - path: /
        pathType: Prefix
        backend:
          service:
            name: vue-login-service
            port:
              number: 80
[root@k8s-master01 nginx-ingress]# kubectl replace -f vue-ingress.yaml
访问
# 换别的IP去访问  403被拒绝了
[root@k8s-master01 diagramhub]# curl -I -H "Host:www.tcloud.com" 192.168.1.100
HTTP/1.1 403 Forbidden
Date: Tue, 19 May 2026 06:38:27 GMT
Content-Type: text/html
Content-Length: 146
Connection: keep-alive
10、Ingress 访问速率限制
有时候需要限制速率降低后端压力,或者限制单个IP每秒的访问速率防止攻击,此时可以使用Nginx的Rate Limit进行配置
官方文档:https://kubernetes.github.io/ingress-nginx/user-guide/nginx-configuration/annotations/#rate-limiting
# 先添加hosts文件 不然测试域名找不到
[root@k8s-master01 nginx-ingress]# tail -1 /etc/hosts
192.168.1.100 www.tcloud.com

# 使用ab进行访问测试
# 20个人同时访问 一共刷1000次
[root@k8s-master01 nginx-ingress]# ab -n 1000 -c 20 -H "Host: www.tcloud.com" http://192.168.1.100/
This is ApacheBench, Version 2.3 <$Revision: 1430300 $>
Copyright 1996 Adam Twiss, Zeus Technology Ltd, http://www.zeustech.net/
Licensed to The Apache Software Foundation, http://www.apache.org/

Benchmarking 192.168.1.100 (be patient)
Completed 100 requests
Completed 200 requests
Completed 300 requests
Completed 400 requests
Completed 500 requests
Completed 600 requests
Completed 700 requests
Completed 800 requests
Completed 900 requests
Completed 1000 requests
Finished 1000 requests


Server Software:
Server Hostname:        192.168.1.100
Server Port:            80

Document Path:          /
Document Length:        403 bytes

Concurrency Level:      20
Time taken for tests:   0.191 seconds
Complete requests:      1000
Failed requests:        0
Write errors:           0
Total transferred:      614000 bytes
HTML transferred:       403000 bytes
Requests per second:    5222.23 [#/sec] (mean)
Time per request:       3.830 [ms] (mean)
Time per request:       0.191 [ms] (mean, across all concurrent requests)
Transfer rate:          3131.30 [Kbytes/sec] received

Connection Times (ms)
              min  mean[+/-sd] median   max
Connect:        0    0   0.3      0       1
Processing:     1    3   2.0      3      13
Waiting:        1    3   1.9      2      13
Total:          1    4   2.0      3      14

Percentage of the requests served within a certain time (ms)
  50%      3
  66%      4
  75%      4
  80%      5
  90%      6
  95%      8
  98%     10
  99%     13
 100%     14 (longest request)
# 说明
Concurrency Level:      20          # 20并发
Complete requests:      1000        # 1000请求全部完成
Failed requests:        0           # 0失败,全部正常200
Requests per second:    5222.23 [#/sec] # 每秒稳定处理约5222请求
# 配置Ingress限率
[root@k8s-master01 nginx-ingress]# vim vue-ingress.yaml
apiVersion: networking.k8s.io/v1
kind: Ingress
metadata:
name: vue-login-ingress
namespace: tcloud
annotations:
# 单IP每秒最多2个请求
nginx.ingress.kubernetes.io/limit-rps: "2"
# 最大并发连接5个
nginx.ingress.kubernetes.io/limit-connections: "5"
# 突发流量倍数
nginx.ingress.kubernetes.io/limit-burst-multiplier: "5"
spec:
ingressClassName: nginx
rules:
- host: www.tcloud.com
http:
paths:
- path: /
pathType: Prefix
backend:
service:
name: vue-login-service
port:
number: 80
# apply
[root@k8s-master01 nginx-ingress]# kubectl replace -f vue-ingress.yaml

# 2个人同时访问20次
[root@k8s-master01 nginx-ingress]# ab -n 20 -c 2 -H "Host: www.tcloud.com" http://192.168.1.100/
This is ApacheBench, Version 2.3 <$Revision: 1430300 $>
Copyright 1996 Adam Twiss, Zeus Technology Ltd, http://www.zeustech.net/
Licensed to The Apache Software Foundation, http://www.apache.org/

Benchmarking 192.168.1.100 (be patient).....done


Server Software:
Server Hostname:        192.168.1.100
Server Port:            80

Document Path:          /
Document Length:        403 bytes

Concurrency Level:      2
Time taken for tests:   0.009 seconds
Complete requests:      20
Failed requests:        9
   (Connect: 0, Receive: 0, Length: 9, Exceptions: 0)
Write errors:           0
Non-2xx responses:      9
Total transferred:      9814 bytes
HTML transferred:       6143 bytes
Requests per second:    2290.16 [#/sec] (mean)
Time per request:       0.873 [ms] (mean)
Time per request:       0.437 [ms] (mean, across all concurrent requests)
Transfer rate:          1097.44 [Kbytes/sec] received

Connection Times (ms)
              min  mean[+/-sd] median   max
Connect:        0    0   0.0      0       0
Processing:     0    1   0.5      1       2
Waiting:        0    1   0.4      1       1
Total:          0    1   0.5      1       2

Percentage of the requests served within a certain time (ms)
  50%      1
  66%      1
  75%      1
  80%      1
  90%      2
  95%      2
  98%      2
  99%      2
 100%      2 (longest request)

# 说明
并发调到2贴合你设置的每秒 2 请求,依旧还有 9 个请求被拦截,限流规则精准生效
Non-2xx responses:9 就是被限流返回 503 拒绝
并发越高拦截越多,并发贴近阈值就少量拦截,和 Ingress 限流机制完全一致
11、Ingress 灰度发布
把一部分流量分给新版本服务,不影响老版本,安全上线!
比如:
- 90% 流量 → v1 旧版本
- 10% 流量 → v2 新版本
# 我们当前的www.tcloud.com 中的登录页面作为v1版本

# 编辑V2版本的页面使用nginx镜像来代替
# 准备pod
[root@k8s-master01 nginx-ingress]# vim deploy-v2.yaml
apiVersion: apps/v1
kind: Deployment
metadata:
  name: vue-login-v2
  namespace: tcloud
spec:
  replicas: 1
  selector:
    matchLabels:
      app: vue-login-v2
  template:
    metadata:
      labels:
        app: vue-login-v2
    spec:
      containers:
      - name: nginx
        image: swr.cn-north-4.myhuaweicloud.com/ddn-k8s/docker.io/library/nginx:latest
        ports:
        - containerPort: 80


# svc
[root@k8s-master01 nginx-ingress]# vim svc-v2.yaml
apiVersion: v1
kind: Service
metadata:
  name: vue-login-service-v2
  namespace: tcloud
spec:
  selector:
    app: vue-login-v2
  ports:
  - port: 80
    targetPort: 80

# apply
[root@k8s-master01 nginx-ingress]# kubectl apply -f deploy-v2.yaml -f svc-v2.yaml
# 创建V2版本的Ingress
[root@k8s-master01 nginx-ingress]# vim ingress-canary.yaml
apiVersion: networking.k8s.io/v1
kind: Ingress
metadata:
  name: vue-login-canary
  namespace: tcloud
  annotations:
    nginx.ingress.kubernetes.io/canary: "true"
    nginx.ingress.kubernetes.io/canary-weight: "10"  # 10%流量到新版本
spec:
  ingressClassName: nginx
  rules:
  - host: www.tcloud.com
    http:
      paths:
      - path: /
        pathType: Prefix
        backend:
          service:
            name: vue-login-service-v2
            port:
              number: 80
# apply
[root@k8s-master01 nginx-ingress]# kubectl apply -f ingress-canary.yaml
# 访问测试,多访问几次,会有10%的流量到达nginx的页面
[root@k8s-master01 nginx-ingress]# curl -H "Host: www.tcloud.com" http://192.168.1.100
<!DOCTYPE html>
<html lang="en">
<head>
<meta charset="UTF-8" />
<meta name="viewport" content="width=device-width, initial-scale=1.0" />
<title>Animated Characters Login</title>
<script type="module" crossorigin src="./assets/index-CF2q_Lv9.js"></script>
<link rel="stylesheet" crossorigin href="./assets/index-D4c0P-1y.css">
</head>
<body>
<div id="app"></div>
</body>
</html>
# 这里的流量就转到了nginx
[root@k8s-master01 nginx-ingress]# curl -H "Host: www.tcloud.com" http://192.168.1.100
<!DOCTYPE html>
<html>
<head>
<title>Welcome to nginx!</title>
<style>
html { color-scheme: light dark; }
body { width: 35em; margin: 0 auto;
font-family: Tahoma, Verdana, Arial, sans-serif; }
</style>
</head>
<body>
<h1>Welcome to nginx!</h1>
<p>If you see this page, the nginx web server is successfully installed and
working. Further configuration is required.</p>
<p>For online documentation and support please refer to
<a href="http://nginx.org/">nginx.org</a>.<br/>
Commercial support is available at
<a href="http://nginx.com/">nginx.com</a>.</p>
<p><em>Thank you for using nginx.</em></p>
</body>
</html>



 扫一扫
扫一扫


05&spm=1001.2101.3001.5002&articleId=160822508&d=1&t=3&u=c9ae0ef4538e44faa49c65baaad2dde8)
 2万+
2万+

 被折叠的 条评论
为什么被折叠?
被折叠的 条评论
为什么被折叠?
 到【灌水乐园】发言


