 本文介绍了使用ZedGraph库绘制饼图的方法,包括设置图表标题、背景填充、图例位置及样式等,并展示了如何创建饼图片段及其相关属性。
PieSampleDemo.cs介绍
这节我把饼形图粗略的介绍一下,如下图。
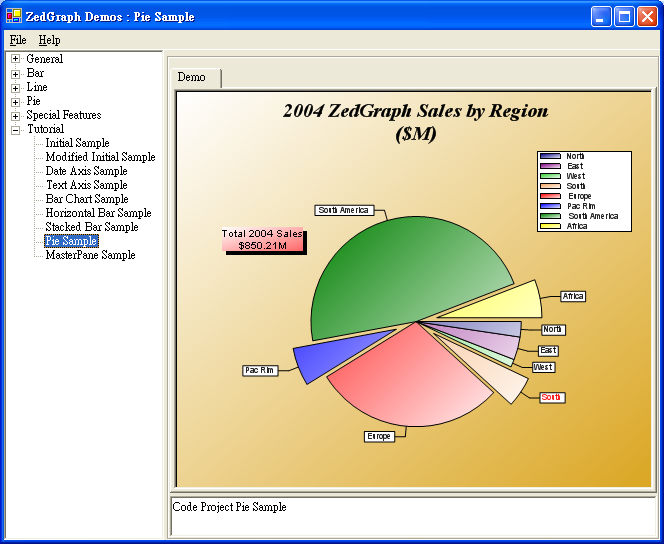 PieSampleDemo.cs(画饼)
using System;
using System.Drawing;
using System.Collections;
using ZedGraph;
namespace ZedGraph.Demo
{
///<summary>
/// Summary description for SimpleDemo.
///</summary>
public class PieSampleDemo : DemoBase
{
public PieSampleDemo() : base( "Code Project Pie Sample",
"Pie Sample", DemoType.Pie, DemoType.Tutorial )
{
GraphPane myPane = base.GraphPane;
// Set the GraphPane title
myPane.Title = "2004 ZedGraph Sales by Region/n($M)";
myPane.FontSpec.IsItalic = true;
myPane.FontSpec.Size = 24f;
myPane.FontSpec.Family = "Times";
// Fill the pane background with a color gradient
myPane.PaneFill = new Fill( Color.White, Color.Goldenrod, 45.0f );
// No fill for the axis background
myPane.AxisFill.Type = FillType.None;
// Set the legend to an arbitrary location
myPane.Legend.Position = LegendPos.Float ;
myPane.Legend.Location = new Location( 0.95f, 0.15f, CoordType.PaneFraction,
AlignH.Right, AlignV.Top );
myPane.Legend.FontSpec.Size = 10f;
myPane.Legend.IsHStack = false;
// Add some pie slices
PieItem segment1 = myPane.AddPieSlice( 20, Color.Navy, Color.White, 45f, 0, "North" );
PieItem segment3 = myPane.AddPieSlice( 30, Color.Purple, Color.White, 45f, .0, "East" );
PieItem segment4 = myPane.AddPieSlice( 10.21, Color.LimeGreen, Color.White, 45f, 0, "West" );
PieItem segment2 = myPane.AddPieSlice( 40, Color.SandyBrown, Color.White, 45f, 0.2, "South" );
PieItem segment6 = myPane.AddPieSlice( 250, Color.Red, Color.White, 45f, 0, "Europe" );
PieItem segment7 = myPane.AddPieSlice( 50, Color.Blue, Color.White, 45f, 0.2, "Pac Rim" );
PieItem segment8 = myPane.AddPieSlice( 400, Color.Green, Color.White, 45f, 0, "South America" );
PieItem segment9 = myPane.AddPieSlice( 50, Color.Yellow, Color.White, 45f, 0.2, "Africa" );
segment2.LabelDetail.FontSpec.FontColor = Color.Red;
// Sum up the pie values
CurveList curves = myPane.CurveList ;
double total = 0 ;
for ( int x = 0 ; x < curves.Count ; x++ )
total += ((PieItem)curves[x]).Value ;
// Make a text label to highlight the total value
TextItem text = new TextItem( "Total 2004 Sales/n" + "$" + total.ToString () + "M",
0.18F, 0.40F, CoordType.PaneFraction );
text.Location.AlignH = AlignH.Center;
text.Location.AlignV = AlignV.Bottom;
text.FontSpec.Border.IsVisible = false ;
text.FontSpec.Fill = new Fill( Color.White, Color.FromArgb( 255, 100, 100 ), 45F );
text.FontSpec.StringAlignment = StringAlignment.Center ;
myPane.GraphItemList.Add( text );
// Create a drop shadow for the total value text item
TextItem text2 = new TextItem( text );
text2.FontSpec.Fill = new Fill( Color.Black );
text2.Location.X += 0.008f;
text2.Location.Y += 0.01f;
myPane.GraphItemList.Add( text2 );
base.ZedGraphControl.AxisChange();
}
}
}
代码分析:
我们先把Legend类的相关属性再补充一下。
// Set the legend to an arbitrary location
myPane.Legend.Position = LegendPos.Float ;
myPane.Legend.Location = new Location( 0.95f, 0.15f, CoordType.PaneFraction,
AlignH.Right, AlignV.Top );
myPane.Legend.FontSpec.Size = 10f;
myPane.Legend.IsHStack = false;
LegendPos是一个枚举,共有13个枚举值:Top、Left、Right、Bottom、InsideTopLeft、InsideTopRight、InsideBotLeft、InsideBotRight、Float、TopCenter、BottomCenter、TopFlushLeft和BottomFlushLeft。具体含义我就不解释了,都是关于Legend位置的。
Location是指定Legend具体坐标的一个类,要注意的是,只有当LegendPos是Float时,Location才会起作用。
FontSpec类就是一个字体类,里面是关于字体的一些相关设置,这里不再细说。
IsHStack是一个Legend的属性,是设置Legend中文字和图形的显示方式是水平还是垂直。
下面说说本节的主角PieItem类:
PieItem segment6 = myPane.AddPieSlice( 250, Color.Red, Color.White, 45f, 0, "Europe" );
Pie重载了五个构造函数,上面是参数最多的一个构造函数,共有六个,意思分别是:在整个饼形图中占的比重,渐变颜色1,渐变颜色2,渐变颜色角度,远离中心点的距离,饼形图的文字注释。
饼形图也是继承 ZedGraph.CurveItem,与其它继承CurveItem不同的是,PieItem有一个value的属性,可以方便的存取PieItem实例的值,从而可以很方便的动态改变一个饼形在整个饼形区域所占的比重。
方法二:
首先引用ZedGraph.dll动态库.
然后在工具箱里"添加/移除项"-----"netframework控件中引用该dll"-----加载到工具箱,然后拖动该该工具到你的窗体,即zedGraphControl1.然后
cs代码:
using System;
using System.Drawing;
using System.Collections;
using System.ComponentModel;
using System.Windows.Forms;
using System.Data;
using ZedGraph;
//定义
public void CreateChart( ZedGraphControl zgc )
{
GraphPane myPane = zgc.GraphPane;
// Set the GraphPane title
myPane.Title = "2004 ZedGraph Sales by Region/n($M)";
myPane.FontSpec.IsItalic = true;
myPane.FontSpec.Size = 24f;
myPane.FontSpec.Family = "Times New Roman";
// Fill the pane background with a color gradient
myPane.PaneFill = new Fill( Color.White, Color.Goldenrod, 45.0f );
// No fill for the chart background
myPane.AxisFill.Type = FillType.None;
// Set the legend to an arbitrary location
myPane.Legend.Position = LegendPos.Float;
myPane.Legend.Location = new Location( 0.95f, 0.15f, CoordType.PaneFraction,
AlignH.Right, AlignV.Top );
myPane.Legend.FontSpec.Size = 10f;
myPane.Legend.IsHStack = false;
// Add some pie slices
PieItem segment1 = myPane.AddPieSlice( 20, Color.Navy, Color.White, 45f, 0, "North" );
PieItem segment3 = myPane.AddPieSlice( 30, Color.Purple, Color.White, 45f, .0, "East" );
PieItem segment4 = myPane.AddPieSlice( 10.21, Color.LimeGreen, Color.White, 45f, 0, "West" );
PieItem segment2 = myPane.AddPieSlice( 40, Color.SandyBrown, Color.White, 45f, 0, "South" );
PieItem segment6 = myPane.AddPieSlice( 250, Color.Red, Color.White, 45f, 0, "Europe" );
PieItem segment7 = myPane.AddPieSlice( 150, Color.Blue, Color.White, 45f, 0, "Pac Rim" );
PieItem segment8 = myPane.AddPieSlice( 400, Color.Green, Color.White, 45f, 0, "South America" );
PieItem segment9 = myPane.AddPieSlice( 50, Color.Yellow, Color.White, 45f, 0, "Africa" );
segment2.LabelDetail.FontSpec.FontColor = Color.Red;
// Sum up the pie values
CurveList curves = myPane.CurveList;
double total = 0;
for ( int x = 0; x < curves.Count; x++ )
total += ( (PieItem)curves[x] ).Value;
// Make a text label to highlight the total value
TextItem text = new TextItem( "Total 2004 Sales/n" + "$" + total.ToString() + "M",
0.18F, 0.40F, CoordType.PaneFraction );
text.Location.AlignH = AlignH.Center;
text.Location.AlignV = AlignV.Bottom;
text.FontSpec.Border.IsVisible = false;
text.FontSpec.Fill = new Fill( Color.White, Color.FromArgb( 255, 100, 100 ), 45F );
text.FontSpec.StringAlignment = StringAlignment.Center;
myPane.GraphItemList.Add( text );
// Create a drop shadow for the total value text item
TextItem text2 = new TextItem( text );
text2.FontSpec.Fill = new Fill( Color.Black );
text2.Location.X += 0.008f;
text2.Location.Y += 0.01f;
myPane.GraphItemList.Add( text2 );
// Calculate the Axis Scale Ranges
zgc.AxisChange();
}
调用
CreateChart(zedGraphControl1);





 扫一扫
扫一扫


&spm=1001.2101.3001.5002&articleId=1958358&d=1&t=3&u=ed8eaed2b9dc40549e5356ee9973efc6)
 6万+
6万+

 被折叠的 条评论
为什么被折叠?
被折叠的 条评论
为什么被折叠?
 到【灌水乐园】发言