


忽然想做一个小学生班级家庭住址的分布图,为啥这样想也不太清楚,哈:
查阅了一些资料,资料很多,热力图,点分布图等,但是好多软件都是城市分布,北京、上海、深圳啥的。本次是一个小城市里的局部分布,资料不太多。
闲话少叙,最后看中了python,最近也正在学习。
有这么几步吧:
1、安装folium、panda
2、根据地址确定经纬度。
3、读数据显示定位。
下面按步骤来
1、安装两个包,用pip 试过了conda 不能install。panda用来读excel表格。
pip install folium
pip install panda
2、因为是小区,没有经纬度数据,只能用笨办法一个个查了,打开百度地图找一下,做成表格。
| ID | longtitude | lattitude |
|---|---|---|
| 1 | 121.451616 | 37.483282 |
百度地图查出来的很不准确,偏差了好多,腾讯高德的也不行,最后试了几次还是谷歌地球的数据相当精准。
3、照葫芦画瓢上程序 参考了另外一篇博客
import pandas as pd
import numpy as np
import os
import folium
from folium import plugins
import webbrowser
full = pd.read_excel("location.xlsx")
full = full.dropna()
schools_map = folium.Map(location=[full['lattitude'].mean(), full['longtitude'].mean()], zoom_start=10)
marker_cluster = plugins.MarkerCluster().add_to(schools_map)

#mark points
for name,row in full.iterrows():
     folium.Marker([row["lattitude"], row["longtitude"]], popup="{0}:{1}".format(row["ID"], 1)).add_to(marker_cluster)

#以学校为中心画圆
folium.CircleMarker(location=[37.48075059,121.449117],
              radius=100,popup='school',color='pink',fill=True,
              fill_color='pink').add_to(schools_map)
display(schools_map)
schools_map.save('schools_map.html')
webbrowser.open('schools_map.html')
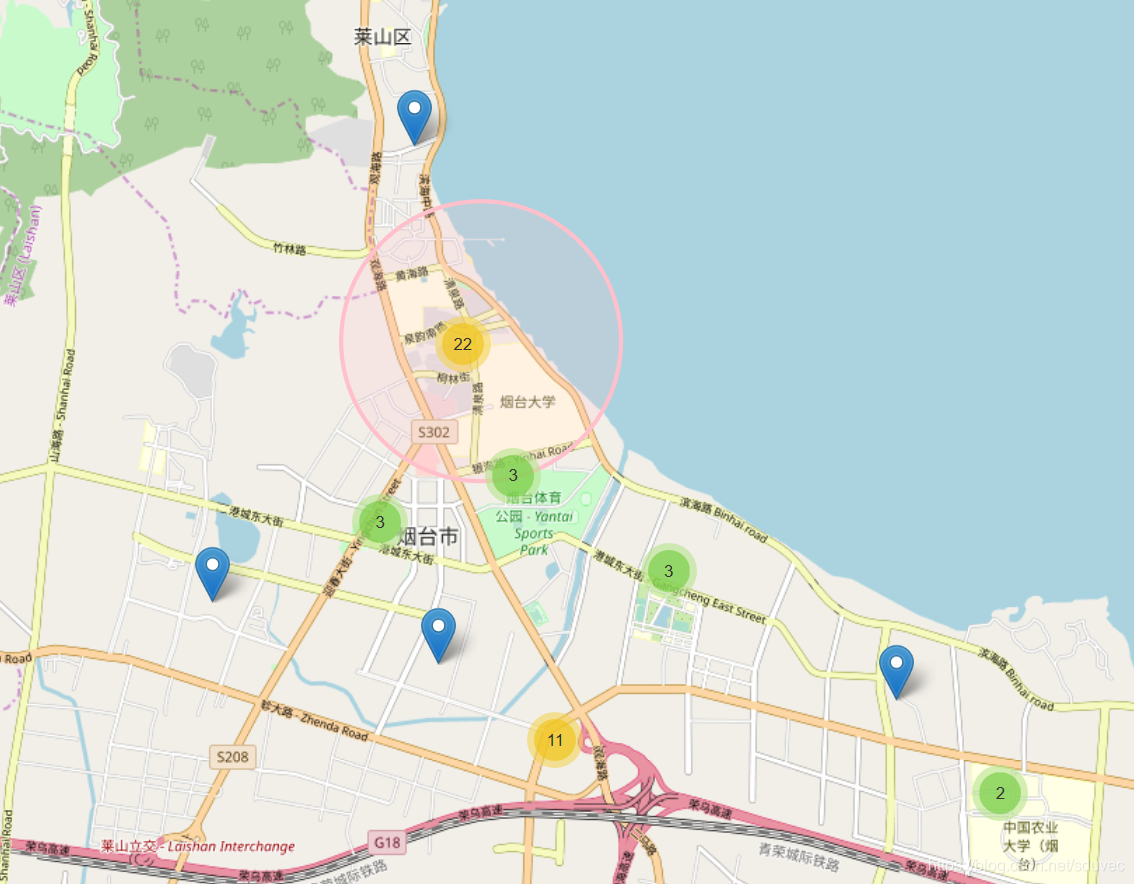
看看同学们都住哪里,家长也看看在哪里适合买房,终究小学生入学是按学区来的,家离得近的多,一半的人都住在附近1000m以内。定好位后可以写个程序看看校车走哪个路线最优啦[异想天开,校车何年何月。。。]。

 432
432


 扫一扫
扫一扫


 被折叠的 条评论
为什么被折叠?
被折叠的 条评论
为什么被折叠?
 到【灌水乐园】发言


