
ABSTRACT
We report on high-resolution spectra of the two recurring novae, T CrB and RS Oph, obtained in 2004 when no outbursts were in progress. Selected regions of the spectra between 6500 and 8800 Å were measured for equivalent widths and analyzed for metallicity. Lines of Fe I, Ni I, Si I, and Ti I were used to establish the effective temperature. The metallicity as derived using models is near solar with an uncertainty estimated to be near a factor of 2 for both stars. Both stars show a strong lithium line at 6707.8 Å. Approximate Li abundances were derived using model atmospheres for a direct comparison with the nearby Fe I line at 6710.31 Å and the Ca I ground level line at 6572.78 Å. The Li abundances are near log N(Li) = 1.2 for RS Oph and 0.8 for T CrB on the scale of log N(H) = 12.0. Such Li abundances are high for single K and M giants. A survey of symbiotic stars with cool components of types K and M showed no recognizable Li line in 28 stars with high quality spectra. This makes the two repeating novae different from the other symbiotics that consist of a red giant and a white dwarf.
1. INTRODUCTION
The two brightest repeating novae are T CrB and RS Oph, the later of which has suffered 7 nova explosions, the most recent of which occurred in 2006 February. T CrB has only shown two explosions, one in 1866 and a second in 1946. Both systems include an M giant whose metallicity may be found, though with difficulty, from high-resolution spectra. It has been suggested that the repeating novae may evolve to become supernovae of Type Ia (SNIa; Hachisu 2003). The role of symbiotic binaries, to which T CrB and RS Oph belong, as viable SNIa progenitors was first discussed by Munari & Renzini (1992). They remarked that to account for the observed frequency of SNIa’s in the Galaxy it is sufficient that only about 4% of the symbiotic binaries conclude their evolution with the accreting white dwarf reaching the Chandrasekhar limit and exploding as a supernova. It is interesting to note that the fraction of known recurrent novae among the symbiotic binaries is a few percent. Supernovae of Type Ia are the brightest stars known at this time. As such, they can be seen at huge distances, reaching galaxies whose redshift is given roughly by z ≃ 1.0. They are sufficiently rare that no SN Ia has been close enough in recent years to permit the identification of the object that later exploded. As mentioned above, suggestions involve the overloading of a white dwarf until its mass reaches the Chandrasekhar Limit, at which point its nuclei fuse to iron-peak elements, mostly Fe and Ni, releasing enough energy for the star to reach Mv ≃ -19. The most recent SN Ia in our galaxy was probably SN1006, which remarkably occurred almost exactly a thousand years ago.
Because it is most unlikely that a lone white dwarf would accrete enough interstellar material to reach the Chandrasekhar Limit, a variety of scenarios have been suggested whereby mass may be transferred from a second star onto a white dwarf. One class of models involves so-called symbiotic binaries, in which a red giant and a white dwarf are in an orbit of roughly two years. The red giant may lose mass by either a stellar wind or by Roche overflow, thereby supplying the material to be captured by the white dwarf. Hachisu (2003) has described models of mass transfer in symbiotic stars that may lead to the system becoming a repeating novae, and subsequently a SN Ia. Because the process of mass transfer must be nearing completion for a star close to the SN stage, the contributing giant may have lost a substantial amount of mass by the time the hot star approaches the limit of about 1.38 M⊙. In that case, the M giant may have lost sufficient mass that its atmosphere has become deficient in hydrogen. The only evidence that a moderate hydrogen deficiency is present would be an enhanced ratio of metals to hydrogen. Hence, we have investigated the [Fe/H] ratio in the red giant component of two repeating novae. As will be described later, we discovered that both stars show a surprisingly strong line of Li I.
2. OBSERVATIONAL DATA
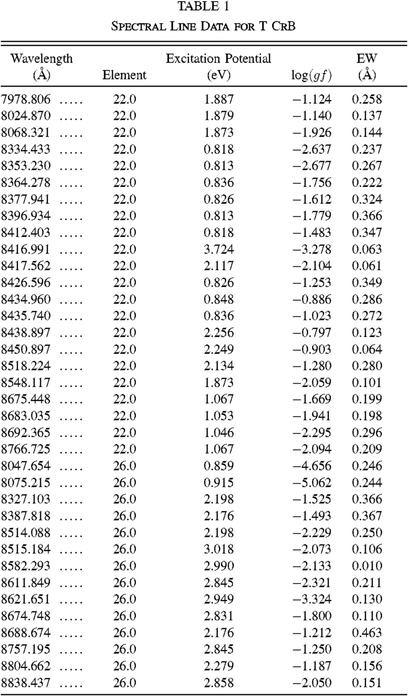
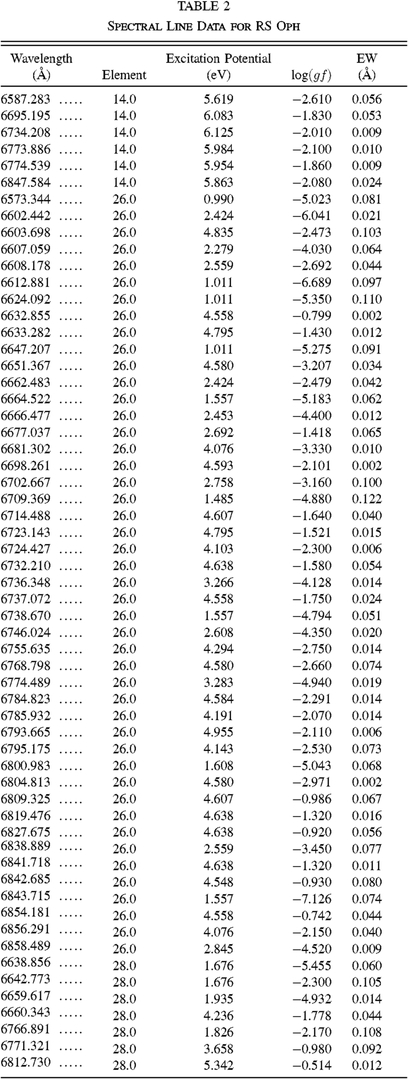
Spectra with a resolving power of about 35,000 were obtained on 2004 6 June for T CrB and on 2004 26 June for RS Oph with the echelle spectrograph of the 3.5-m telescope at the Apache Point Observatory. The data were reduced and measured with the standard IRAF2 routines and measured with the SPLOT routine to derive equivalent widths by fitting individual lines with a Gaussian profile. We show sections of the spectra in Figure 1. The region around 6700 Å is shown to exhibit the strong Li line in each star. Note the much greater strength of the TiO band at 6717 Å in T CrB as compared to RS Oph. In fact, the weakness of the strongest TiO band at 7054 Å indicates that other TiO features should be undetectable in RS Oph. For T CrB it was necessary to use the 8400–8800 Å region and the line list of Woolf & Wallerstein (2005) that was successfully employed for M-dwarf stars. The signal-to-noise ratio in the 8400–8800 Å region is about 15 per pixel in the T CrB spectrum, and in the 6600–6900 Å region of RS Oph the signal-to-noise ratio is 27, much of which is due to unrecognized blending by weak lines. Hence, the accuracy of the equivalent widths is due largely to blending and noise rather than to other causes. Our equivalent widths are shown in Tables 1 and 2 along with atomic data for the measured lines. We chose to measure only lines from elements represented by several lines. For T CrB we used only lines of Ti I and Fe I. For RS Oph, whose TiO was very weak, we measured lines from 6572 to 6858 Å including lines of Si I and Ni I to achieve as wide a range as possible of lower excitation potential.
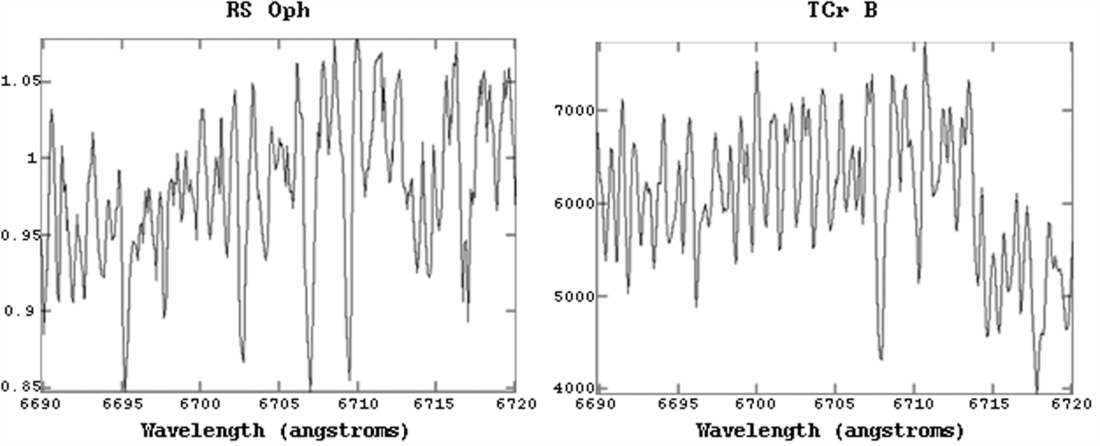
Fig. 1.— Spectra of T CrB and RS Oph in the 6700 Å region. The lithium line is at 6707.8 Å.
 |
 |
In addition, we have inspected high-resolution spectra of other symbiotic stars obtained at the Asiago Observatory to see if the presence of Li I is common in the cool component of symbiotics or is unusual.
3. ATMOSPHERIC PARAMETERS
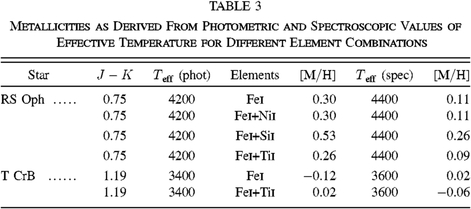
There are two ways to estimate the effective temperature (Teff) of a cool star, spectroscopic and photometric. In the spectroscopic method, lines of a common element such as iron with a range of lower excitation potentials are used to derive abundances and Teff is estimated by requiring that the abundances be independent of excitation potential. For these stars we have rather fewer lines than are usually used in G and K stars. Hence, we have included lines of additional species such as Si I to provide higher excitation lines and Ti I to provide lower excitation lines than are covered by iron. Line identifications and their log(gf) and excitation potentials were taken from VALD3. To place these other lines on the same scale as Fe I, we assumed the abundance ratios in the stars to be solar, and used the abundance values given by Lodders (2003). For example, the solar abundance of Fe I given by Lodders is 7.47, whereas the abundance of Ni I is 6.22; the difference between these two values is 1.25. Therefore, to place Ni I on the same scale as Fe I, for determining Teff, 1.25 was subtracted from the log(gf) values for each Ni I line in the spectra of RS Oph. This same method was used for Si I and Ti I lines in the spectra as well. To determine Teff, the derived abundance was plotted against excitation potential using NextGen model atmospheres (Hauschildt et al. 1999) and the line formation program MOOG. We assumed that log(g) = 2, which is characteristic of giants. We find a somewhat wide range of acceptable Teff values. For RS Oph acceptable slopes limit Teff to between 4100 and 4400 K. The derived value of [M/H] = +0.17 ± 0.1 for an uncertainty of ± 200 K. For T CrB we have gone to the 8400–8800 Å region to use most of the same lines as were used by Woolf & Wallerstein (2005) for M dwarfs and found a rather good fit at 3400 K for Fe I lines only and 3600 K for the Fe I and Ti I lines combined. For Teff = 3500 ± 100 K the derived [M/H] = -0.1 ± 0.1.
In the photometric method, an appropriate color is selected and, after correcting for interstellar reddening, is transformed into Teff by the established correlation. For M stars, the color index J - K is best because the hot companion has little influence in the infrared and the correlation with Teff is well established by Alonso et al. (1999). In Table 3 we show the colors of RS Oph and T CrB as observed by 2MASS. For T CrB, at a galactic latitude of 48.16°, the interstellar reddening may be assumed to be negligible. For RS Oph, on the other hand, at a galactic latitude of 10.37, there is significant interstellar reddening. By using nearby AO stars with known photometric colors, we estimate a color excess of 0.78 in B - V, which implies a color excess of 0.39 in J - K. Turning now to the calibration by Alonso et al (1999) we find Teff = 3600 K for T CrB and Teff = 4100–4400 K for RS Oph. Therefore both absorption line analysis and photometric calibrations converge to similar values for the temperatures of both stars. Considering the uncertainties in effective temperature, our derived abundances of the heavy elements are close enough to solar that we found no evidence of a hydrogen deficiency in either T CrB or RS Oph.
 |
4. THE LITHIUM ABUNDANCE
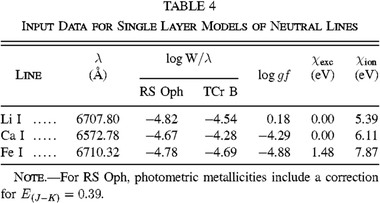
To our surprise we have found that both stars show a substantial line of Li I at 6707.8 Å. In T CrB it had already been seen by Shahbaz et al. (1999). Lithium in early M stars has been studied for many years starting with Merchant (1967) and surveyed more recently by Luck & Lambert (1982). In T CrB the Li line is blended with TiO, while in RS Oph it is well defined despite some blending by unidentified lines. In Figure 1 we show the spectra of both stars between 6690 and 6720 Å. For RS Oph, the weak features are not TiO since the strongest band at 7054 Å is very weak. The equivalent widths of the Li lines in both RS Oph and T CrB are shown in Table 4, which includes other pertinent data for the Li line and two comparison lines selected to respond to the parameters of stellar atmospheres similarly to the Li line.
 |
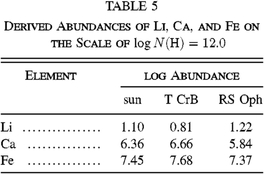
To derive a quantitative estimate of the Li abundances, we have employed the solar metallicity models of Hauschildt et al. (1999). As for our analyses of the metallicities described above, we used the following parameters: For RS Oph Teff = 4400 K, log g = 2,  and for T CrB Teff = 3600, log g = 2.0, vmicro = 2.0 km sec-1. The similarly low excitation levels and ionization potentials make the derived ratios of Li/Ca and Li/Fe insensitive to uncertainties in Teff. The similarities in equivalent width eliminates any uncertainty in the Li abundances that might be introduced by the uncertainty in
 . Finally the similarity in wavelength of the Li and Fe line overcome any opacity differences and overall differences in blending by weak lines. The derived abundances are shown in Table 5.
 |
In summary, it appears that the Li abundances are close to being solar. For T CrB Shahbaz et al. (1999) found log N(Li) = 0.5 from a model with Teff = 3200, which would naturally yield a lower Li abundance than our model of Teff = 3600. A Teff = 3200 sounds a little low to us for a star of type M3III. The question now arises as to the uniqueness of the Li presence in T CrB and RS Oph. For a small sample of single giants of type K5 to M3, Li abundances ranging from  to +0.25 were found by Luck & Lambert (1982). In a large survey of G and K giants Brown et al. (1989) found a few stars with log N(Li) = 3.0. Most of those very Li-rich K giants have been found to show IR excesses indicating recent substantial mass-loss (Gregorio-Hetem et al. 1993). In a survey of 145 giants of luminosity class II by Lebre et al. (2006) the maximum value of log N(Li) of 25 stars with Teff < 4500 was 1.2.
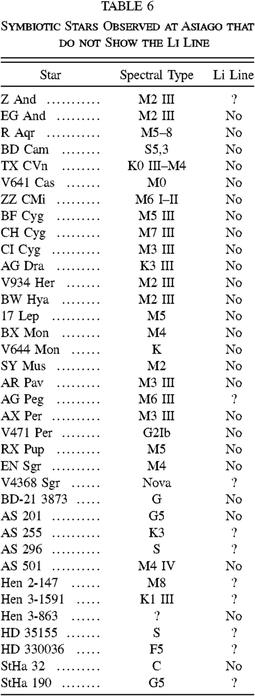
A preferable comparison is with other symbiotic binaries. or closely related stars. Of 43 symbiotic stars surveyed with the Asiago Echelle spectrograph only T CrB and RS Oph show the Li line. Twelve stars are seriously blended and in the remaining stars the line is clearly absent. Of the 31 stars of types K, M, or S the majority are of type M. Stars of type M3 and later show substantial TiO in the 6700 Å region, but a line comparable in strength to that seen in T CrB would easily have been seen. For 18 stars additional observations were obtained at a resolution of 48,000, but they also failed to show a recognizable Li line. A list of symbiotics that do not show the Li line is presented in Table 6. It appears that the strong Li line seen in T CrB and RS Oph is indeed unusual, though an exception to this is the symbiotic Mira V407 Cyg (Tatarnikova et al. 2003). It is interesting that Li has been detected in the cool components of 5 X-ray binaries and discussed most recently by Casares et al. (2007). All 5 stars show log N(Li) ≅ 2.2 and all have K-dwarf or subgiant companions. A search for Li in 8 cataclysmic binaries that show the spectrum of the cool component in the 6700 Å region was not successful (Martin et al. 1995). This may relate the recurrent novae to the X-ray binaries, a sort of subgroup of the symbiotic stars.
 |
5. DISCUSSION
In this paper we have derived two important properties of the red giant components of T CrB and RS Oph. First, they appear to have a normal ratio of metals to hydrogen. This implies that they have not reached the stage of having lost sufficient mass that material enriched in He has risen to the observable layers of their atmospheres. Second, they both show an unusual abundance of Li for stars of type M, including symbiotics with M-type cool components.
The Li abundance is too high to be left over from their youth on the main sequence. Most likely it has been produced recently by the fusion of  and 3He and convected to the surface on a timescale sufficiently short for the 7Be to reach the surface before decaying to 7Li, while still at a temperature that it can capture a proton (Cameron & Fowler 1971). There is a remote chance that the Li seen in the two cool stars was captured at the time of the previous nova explosion and has not yet been convected down to where it can capture a proton.
Footnotes
- 2
The Image Reduction and Analysis Facility is distributed by the National Optical Astronomy Observatories, which are operated by the Association of Universities for Research in Astronomy, Inc., under cooperative agreement with the National Science Foundation.
- 3
The Vienna Atomic line Database (VALD) is a collection of atomic line parameters of astrophysical interest and can be accessed via http://ams.astro.univie.ac.at/VALD/.
