Isomap Embedding - An Awesome Approach to Non-linear Dimensionality Reduction
How to use Isometric Mapping to "unroll the Swiss roll"?
Machine Learning
Intro
I continue the series on Machine Learning algorithms with a look at another dimensionality reduction technique known as Isometric Mapping or Isomap for short.
In the article, I answer the following questions:
What category of Machine Learning techniques does Isomap belong to?
How does Isomap work? Which I explain through a visual example rather than complicated maths.
How to use Isomap to reduce the dimensions of my data in Python?
Isomap within the family of Machine Learning algorithms
There are so many Machine Learning algorithms that it may never be possible to collect and categorize them all. However, I have attempted to do it for some of the most commonly used ones, which you can find in the interactive sunburst chart below. Make sure to explore the chart by clicking👇 on different categories to enlarge and reveal more.
If you enjoy Data Science and Machine Learning, please subscribe to get an email whenever I publish a new story.
As you can see, Isomap is an Unsupervised Machine Learning technique aimed at Dimensionality Reduction.
It differs from a few other techniques in the same category by using a non-linear approach to dimensionality reduction instead of linear mappings used by algorithms such as PCA. We will see how linear vs. non-linear approaches differ in the next section.
How does Isometric Mapping (Isomap) work?
Isomap is a technique that combines several different algorithms, enabling it to use a non-linear way to reduce dimensions while preserving local structures.
Before we look at the example of Isomap and compare it to a linear method of Principal Components Analysis (PCA), let's list the high-level steps that Isomap performs:
Use a KNN approach to find the k nearest neighbors of every data point. Here, "k" is an arbitrary number of neighbors that you can specify within model hyperparameters.
Once the neighbors are found, construct the neighborhood graph where points are connected to each other if they are each other's neighbors. Data points that are not neighbors remain unconnected.
Compute the shortest path between each pair of data points (nodes). Typically, it is either Floyd-Warshall or Dijkstra's algorithm that is used for this task. Note, this step is also commonly described as finding a geodesic distance between points.
Use multidimensional scaling (MDS) to compute lower-dimensional embedding. Given distances between each pair of points are known, MDS places each object into the N-dimensional space (N is specified as a hyperparameter) such that the between-point distances are preserved as well as possible.
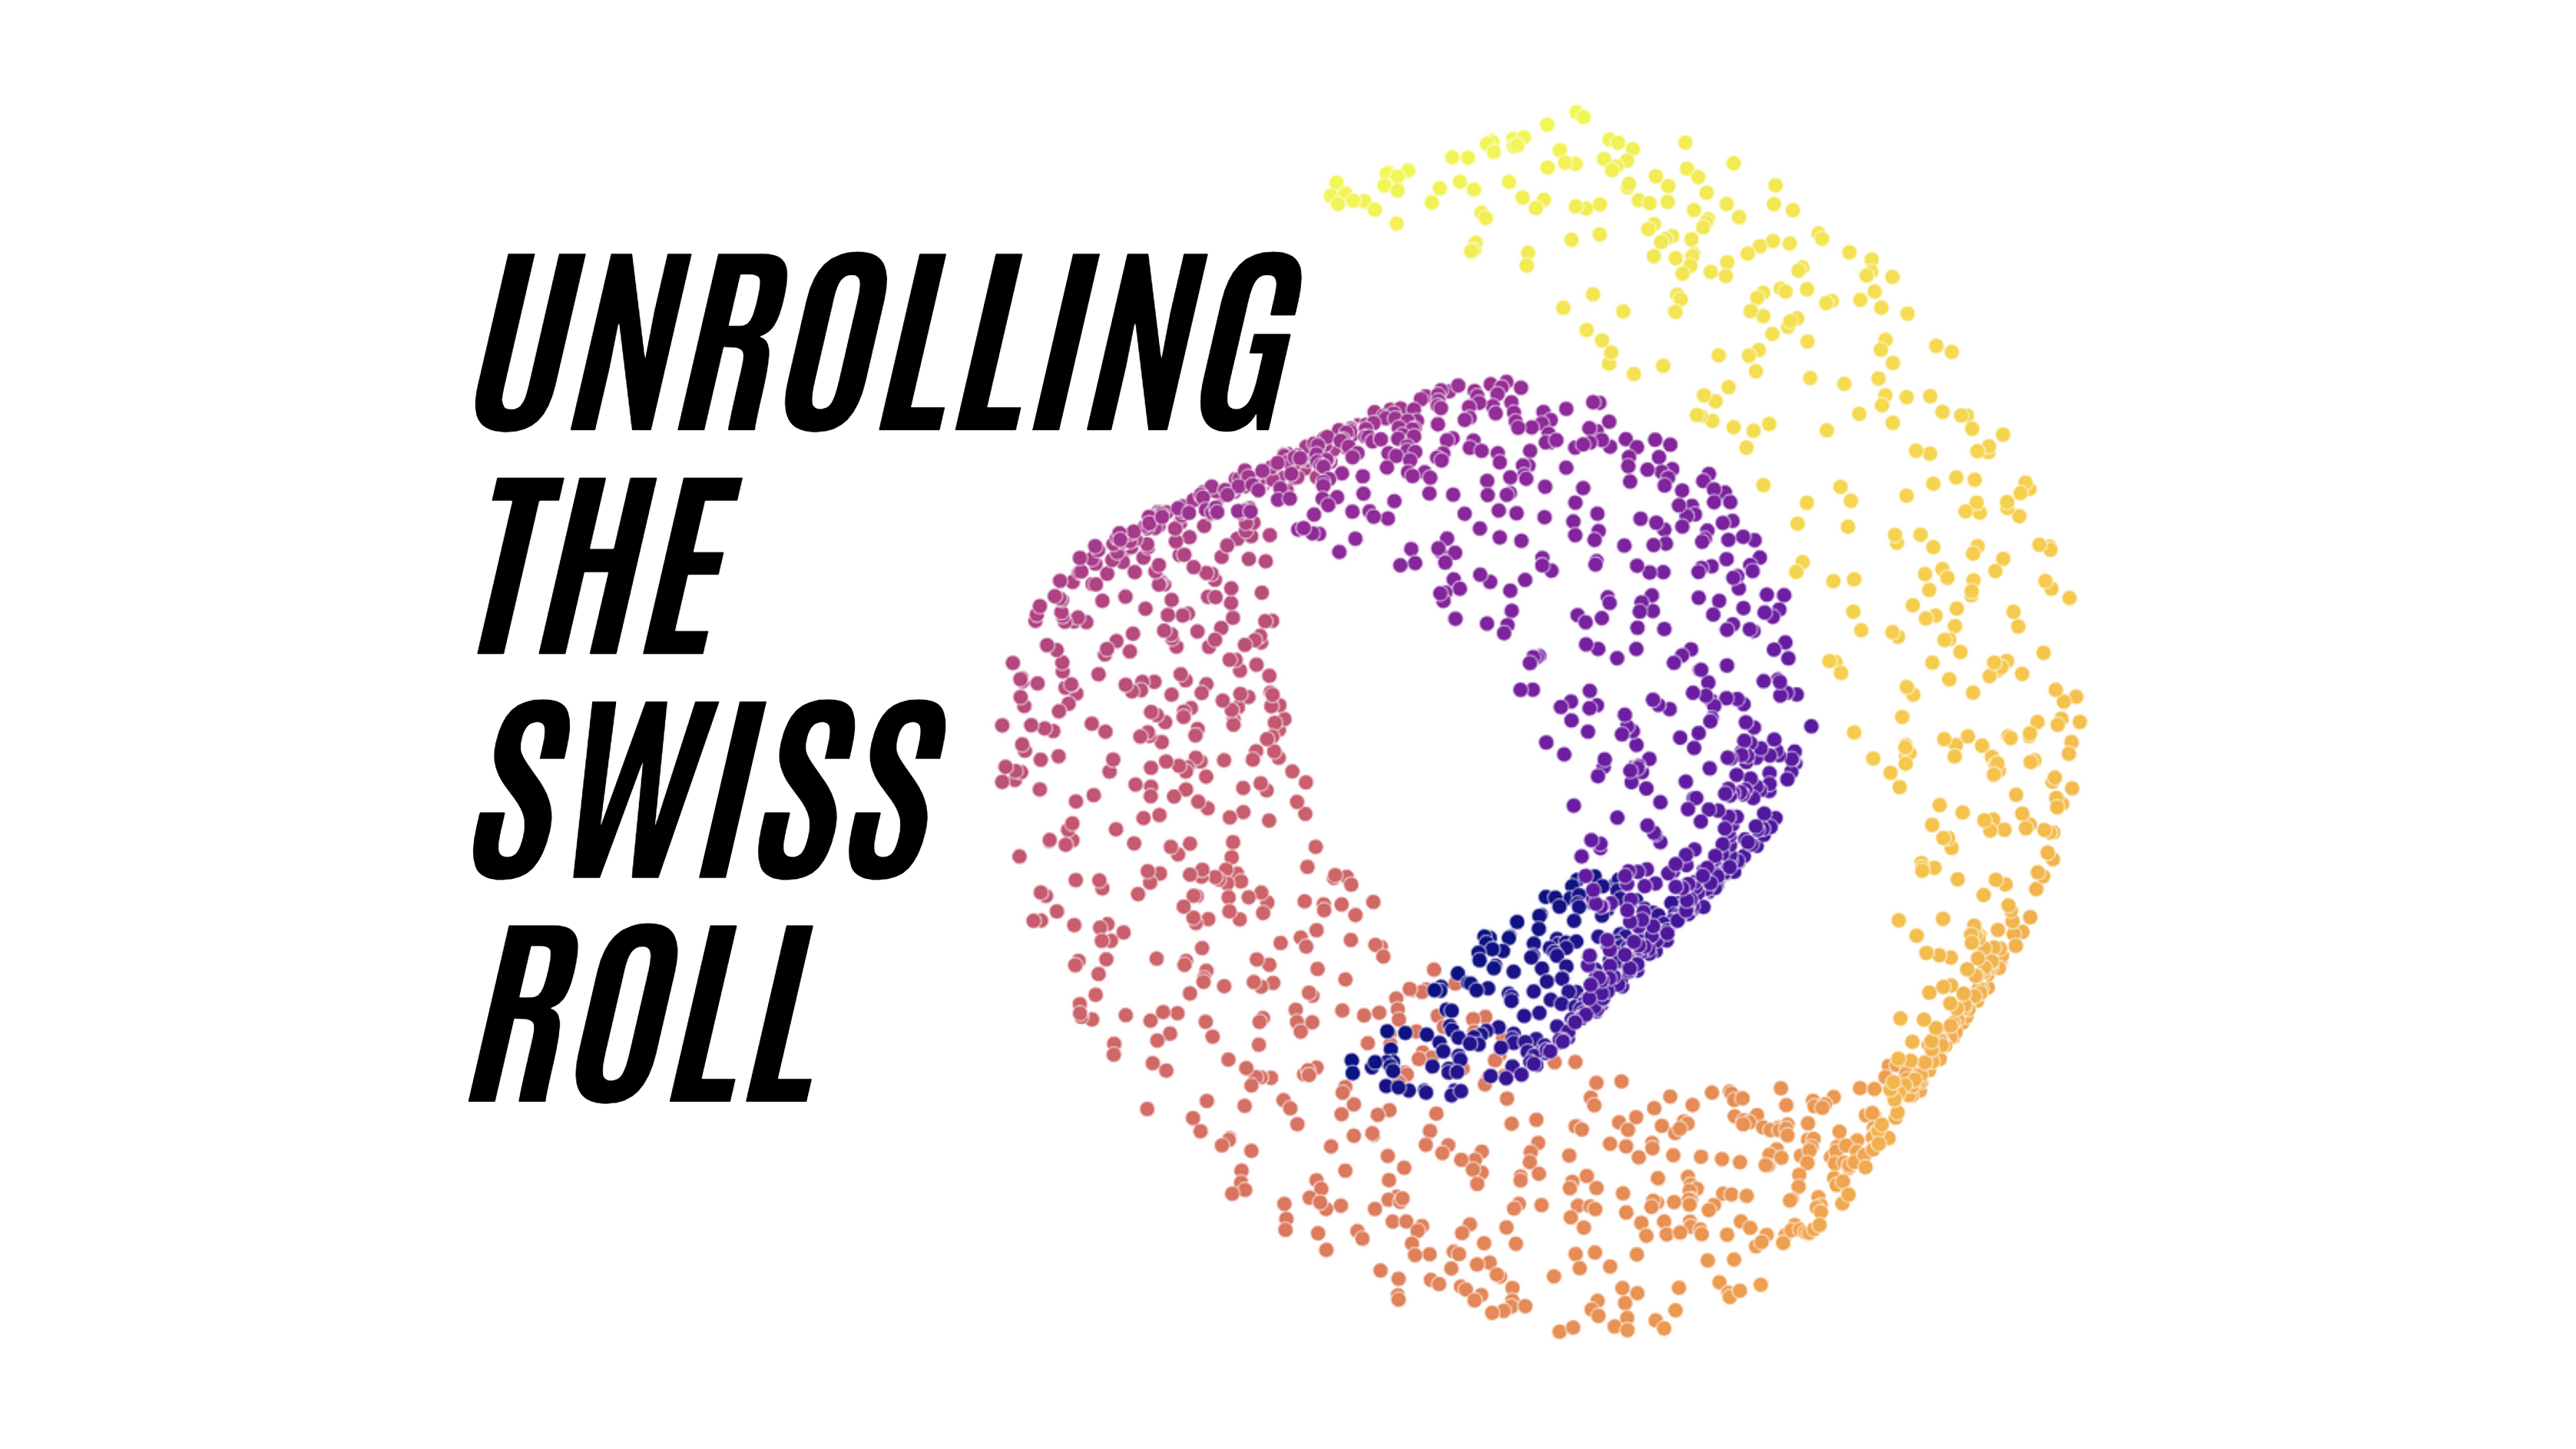
For our example, let's create a 3D object known as a Swiss roll. The object is made up of 2,000 individual data points. The chart is interactive so make sure to rotate it to familiarize yourself with its exact shape.
Next, we want to map this 3-dimensional swiss roll 2 dimensions using Isomap. To track what happens during this transformation, let's select two points: A and B.
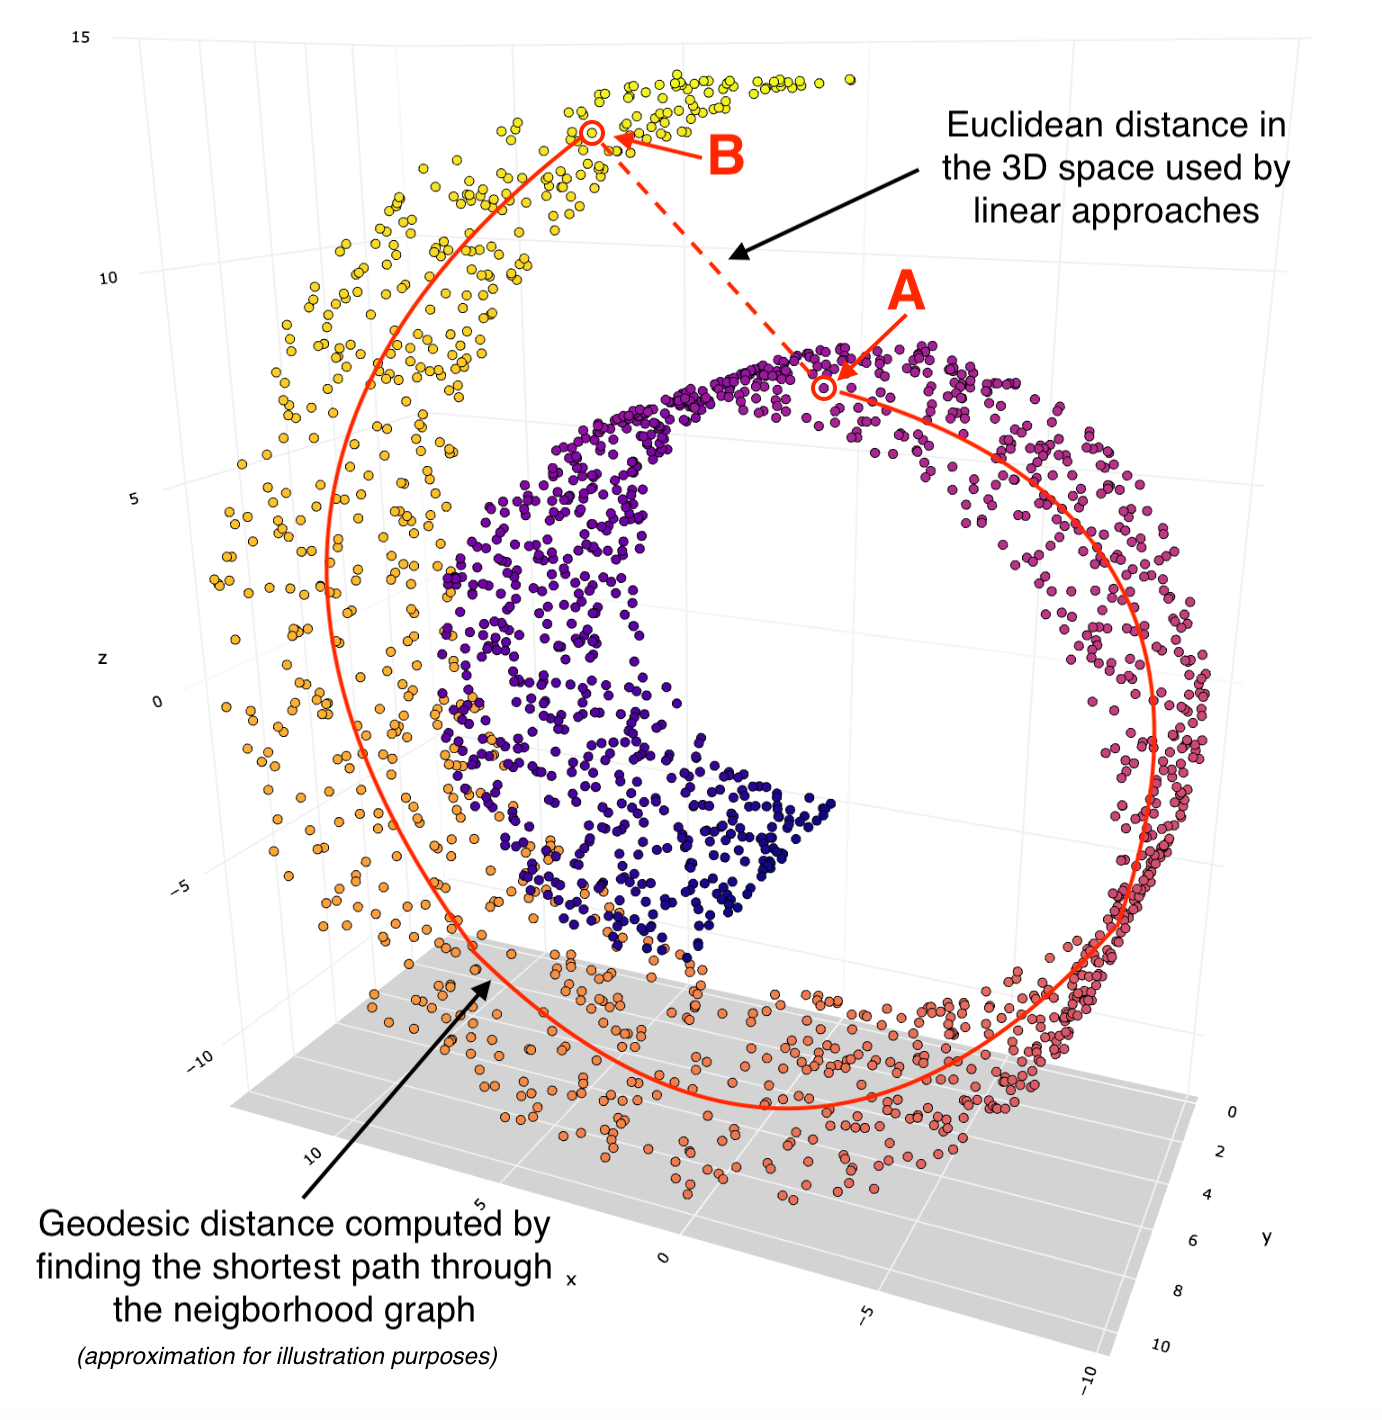
We can see that these two points are relatively close to each other within the 3D space. If we used a linear dimensionality reduction approach such as PCA, then the Euclidean distance between these two points would remain somewhat similar in lower dimensions. See PCA transformation chart below:
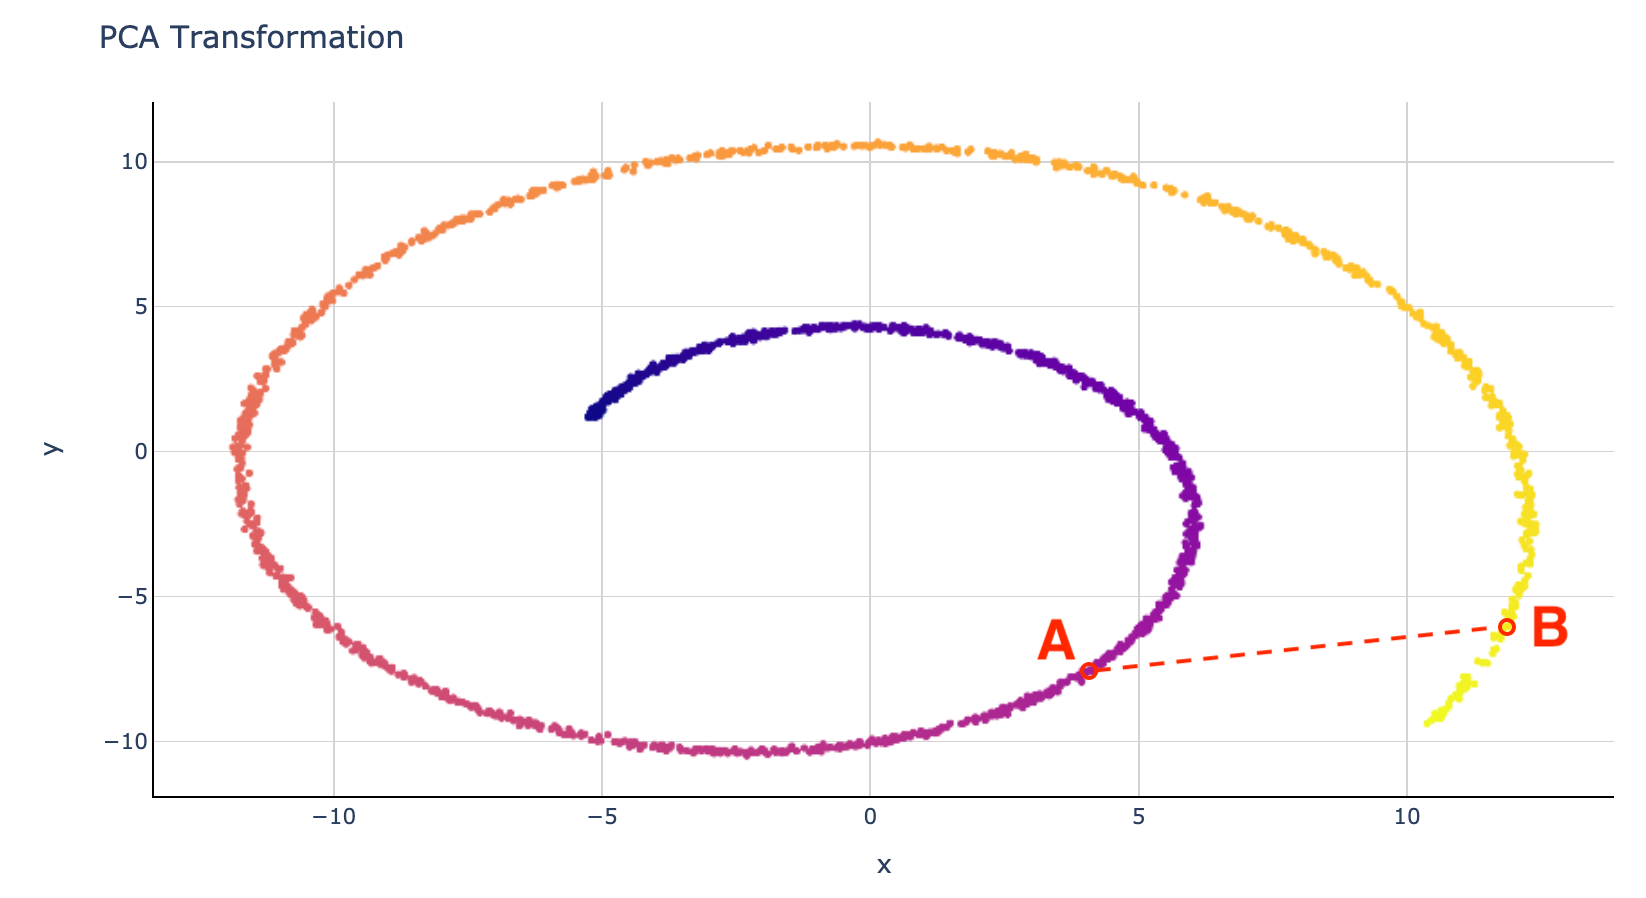
Note, the shape of a 2D object in PCA looks like a picture taken of the same 3D object but from a specific angle. This is a feature of linear transformation.
Meanwhile, non-linear approaches such as Isomap give us a very different result. We can describe such transformation as unrolling the Swiss roll and laying it flat on a 2D surface:
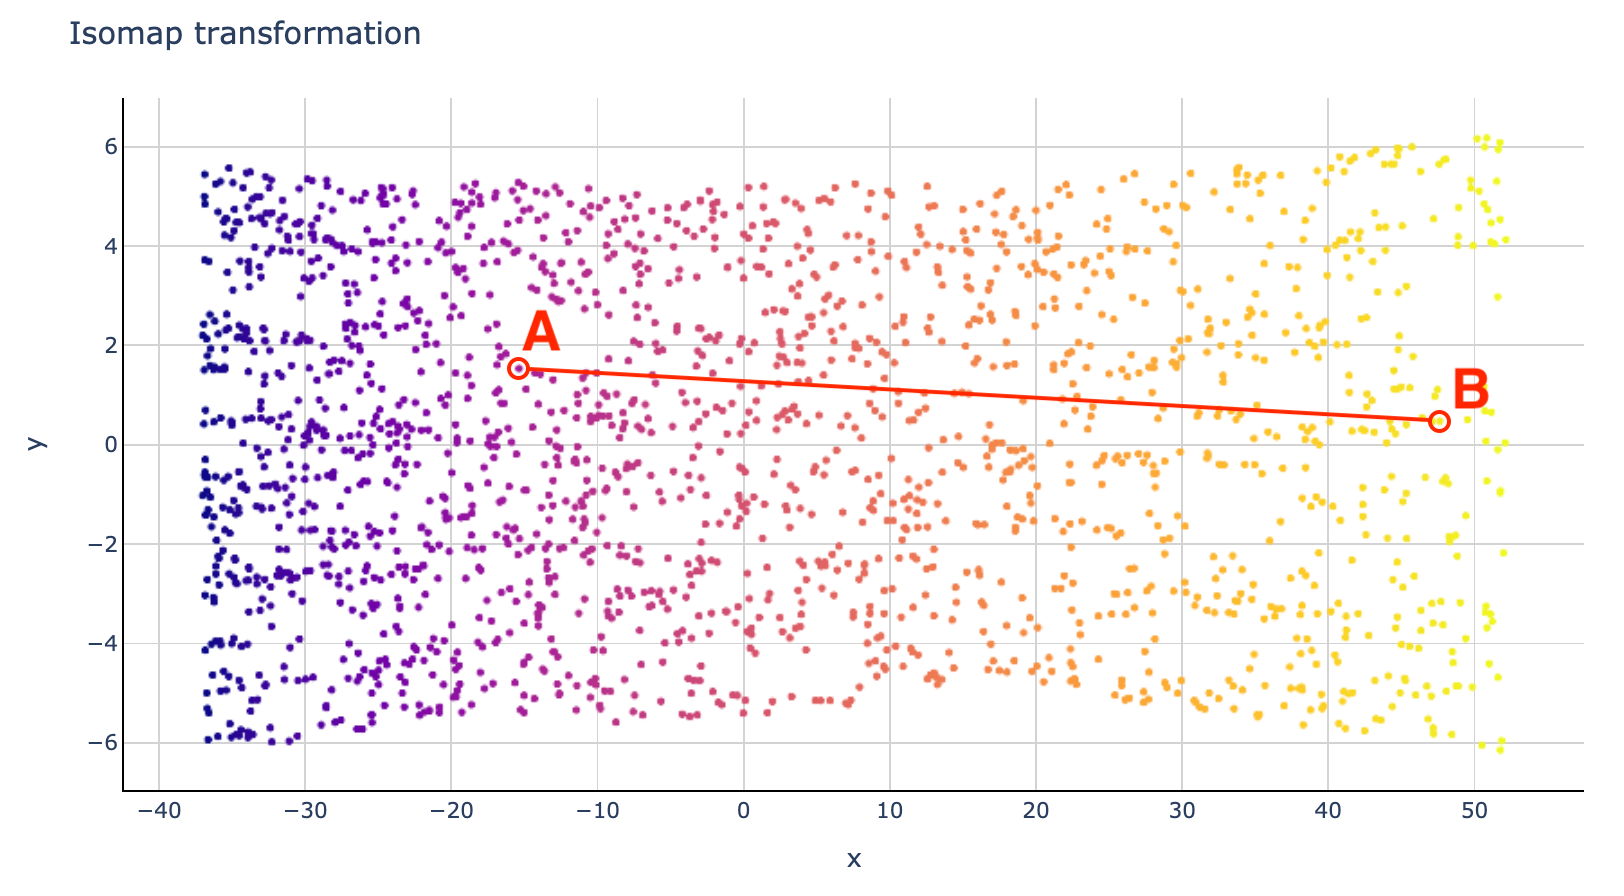
We can see that the distance between points A and B in a 2D space is based on the geodesic distance computed by going through the neighborhood connections.
That's the secret to Isomap's ability to perform non-linear dimensionality reduction while balancing the relationship between local and global structures.

How to use Isomap in Python to reduce the dimensions of my data?
Let's now use Isomap to reduce the high dimensionality of pictures within the MNIST dataset (a collection of handwritten digits). This will enable us to see how different digits cluster together in a 3D space.
SetupWe will use the following data and libraries:
Scikit-learn library for 1) MNIST digit data from sklearn's datasets (load_digits); 2) performing Isometric Mapping (Isomap);
Let's import libraries.
Next, we load the MNIST data.

Let's display the first 10 handwritten digits, so we have a better idea of what we are working with.
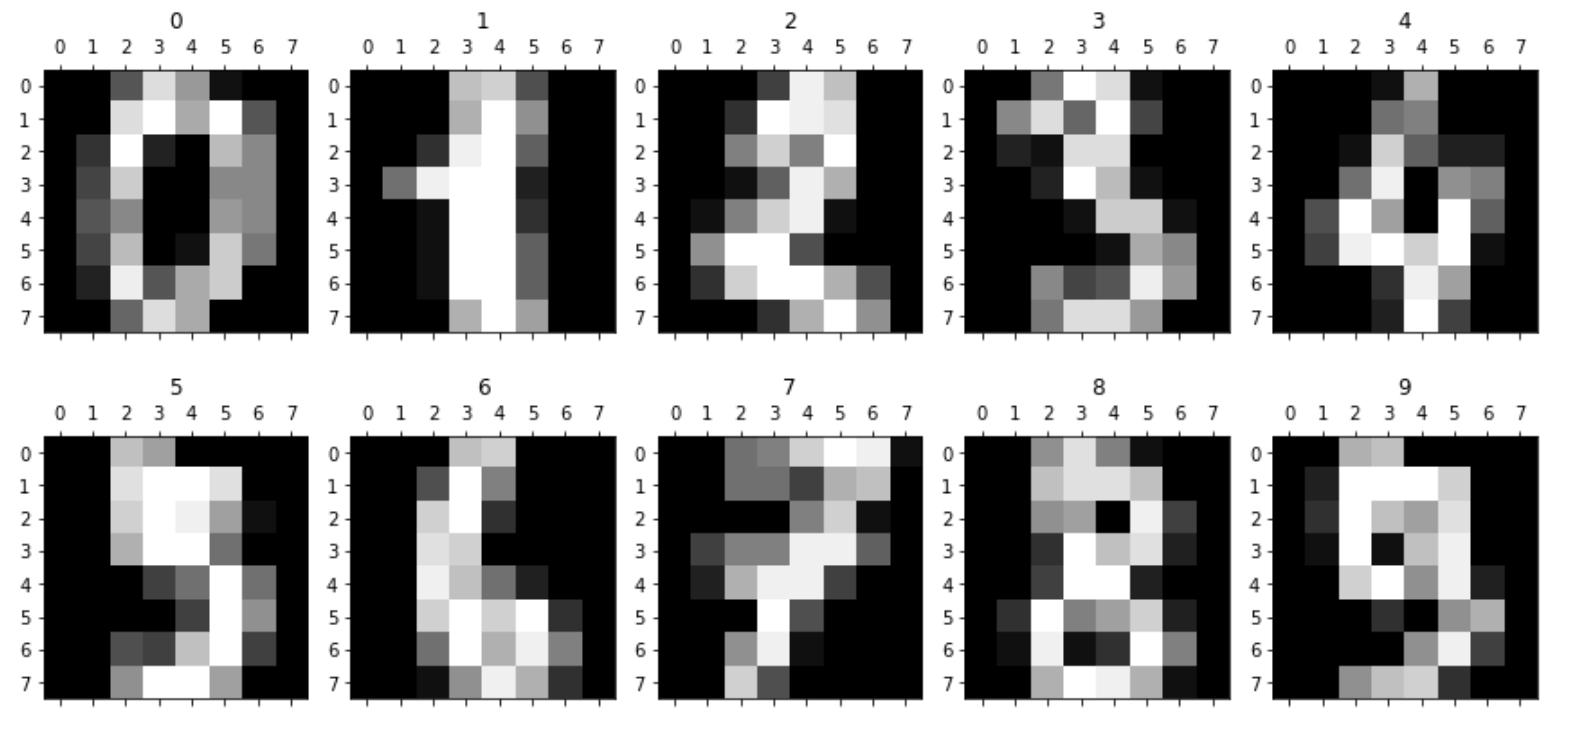
Isometric MappingWe will now apply Isomap to reduce the number of dimensions for each record in the X array from 64 to 3.

Finally, let's plot a 3D scatter plot to see what the data looks like after reducing dimensions down to 3.
Here is an interactive graph with the results. Make sure to rotate it to see the separation between each group of digits.
As you can see, Isomap has done a wonderful job in reducing dimensions from 64 to 3 while preserving non-linear relationships. This enabled us to visualize the clusters of handwritten digits in a 3-dimensional space.
If we wished, we could now easily use one of the classification models such as Decision Trees, SVM, or KNN to predict each handwritten digit label.
Conclusions
Isomap is one of the best tools for dimensionality reduction, enabling us to preserve non-linear relationships between data points.
We have seen how the Isomap algorithm is used in practice for handwritten digit recognition. Similarly, you could use Isomap as part of the NLP (Natural Language Processing) analysis to reduce the high dimensionality of text data before training a classification model.
I sincerely hope this article has made it easy for you to see how Isomap works and its benefits in Data Science projects.
Feel free to reach out if you have any questions or suggestions.
Cheers 👏 Saul Dobilas
t-SNE Machine Learning Algorithm - A Great Tool for Dimensionality Reduction in Python
UMAP Dimensionality Reduction - An Incredibly Robust Machine Learning Algorithm