What is Cosine Similarity? How to Compare Text and Images in Python
A great tool for machine learning

Calculating similarity can be incredibly useful when building machine learning applications. If you need to cluster documents based on how similar the content is or if you're building a model to match images, you will need a method to determine what is and isn't similar. It's pretty easy to do this using numerical data, but how do we determine the similarity of documents or images?
Cosine Similarity is a method of calculating the similarity of two vectors by taking the dot product and dividing it by the magnitudes of each vector, as shown by the illustration below:
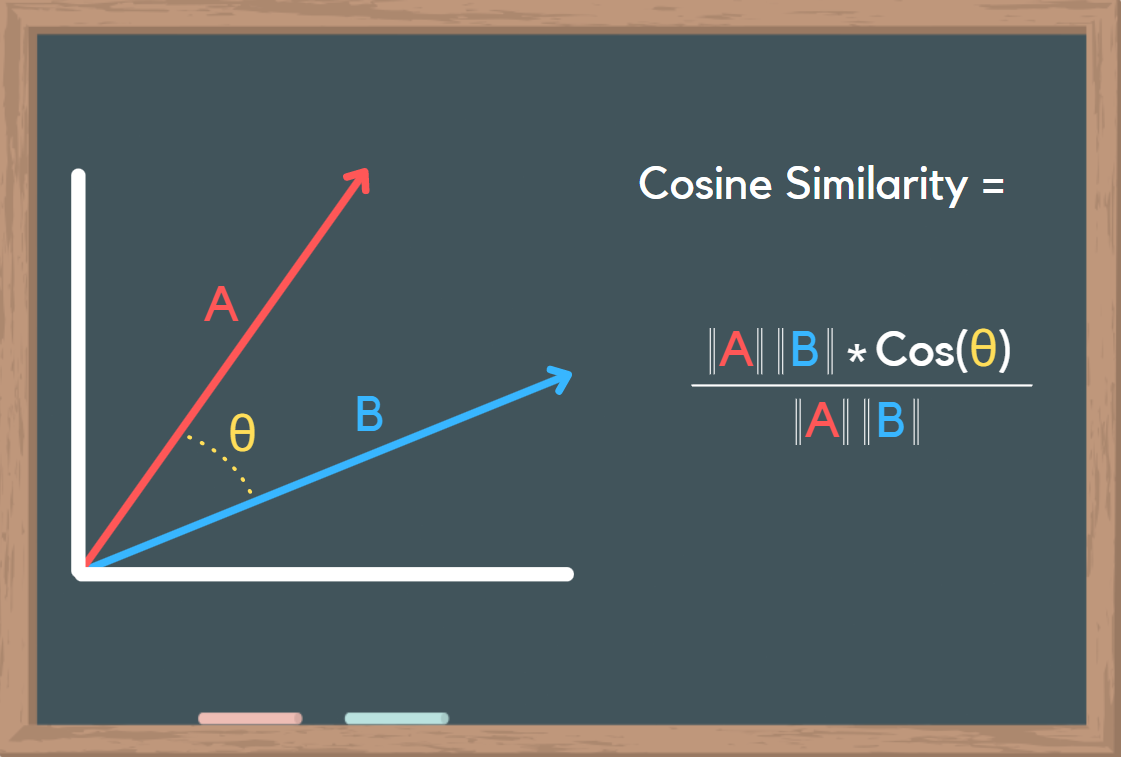
Using python we can actually convert text and images to vectors and apply this same logic! Scikit-learn, PIL, and Numpy make this process even more simple. In this article, I'll show you a couple of examples of how you can use cosine similarity and how to calculate it using python.
Cosine Similarity With Text Data
The process of transforming text to vectors is very common in Natural Language Processing. There are many different ways to vectorize text and this article does a great job of explaining some of them. There are pros and cons to each method but they all essentially achieve the same result: transforming text into numbers.
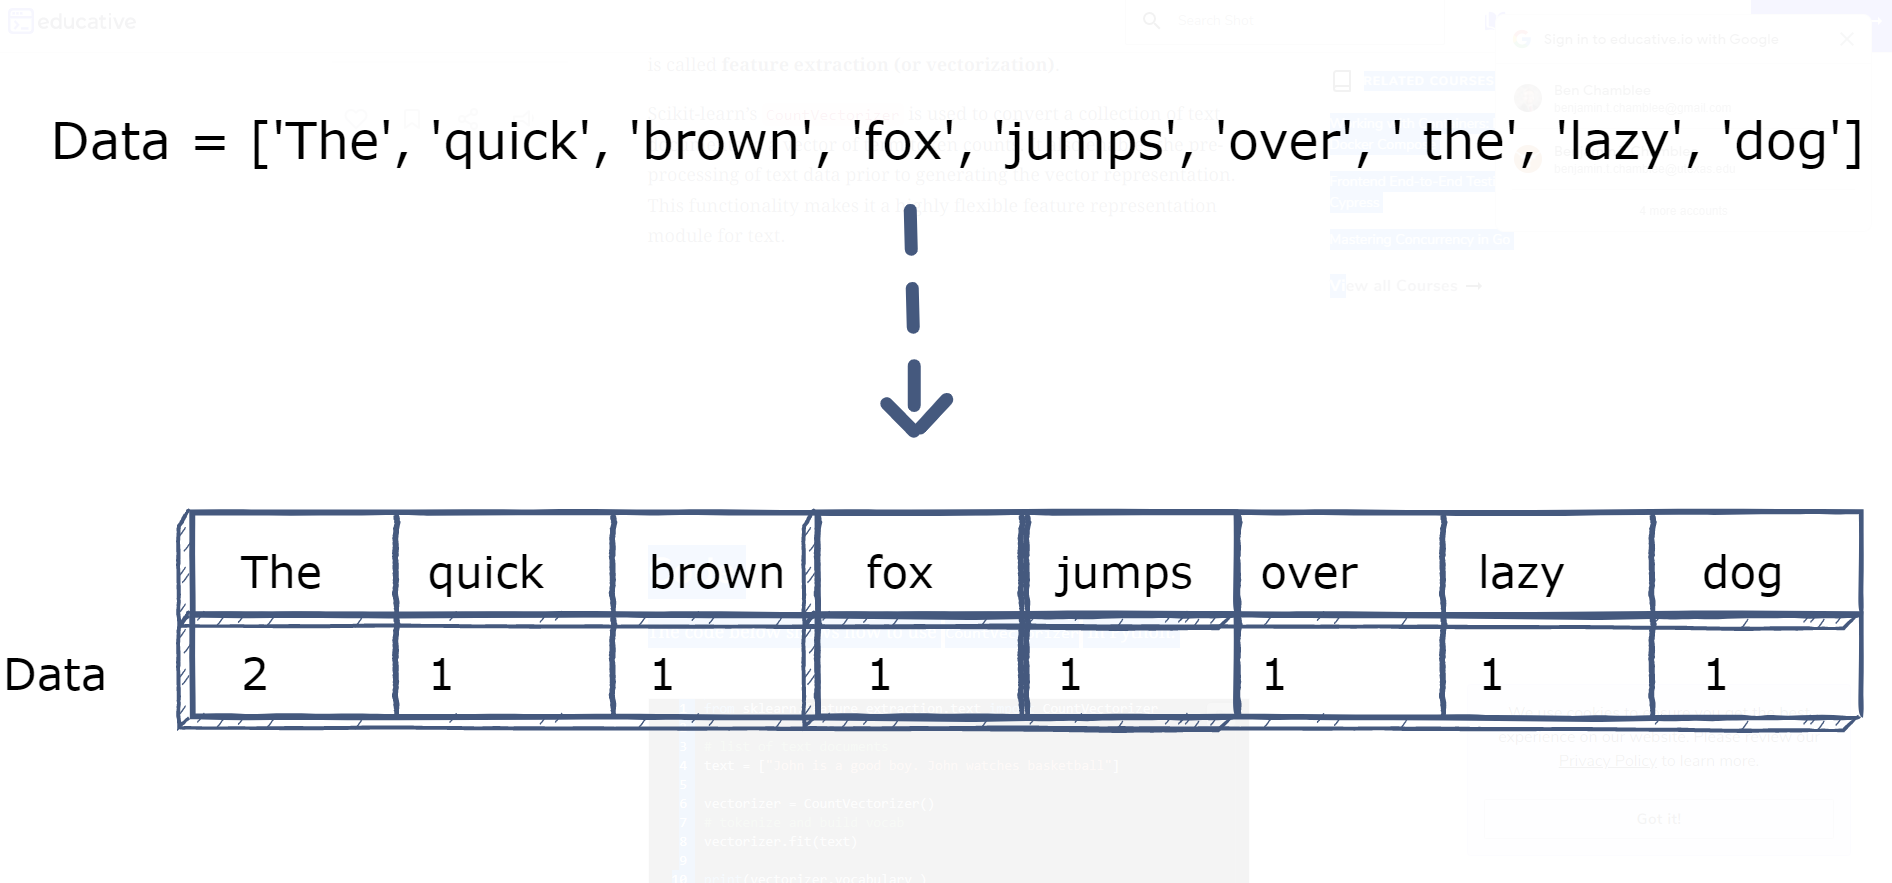
Let's try this out in python - first, we'll need to load our text data and use sklearn's Text CountVectorizer to create this vector. For this example, I want to compare two similar paragraphs so I'll use the first paragraph of the "Bee" Wikipedia page and the first line from Bee Movie.
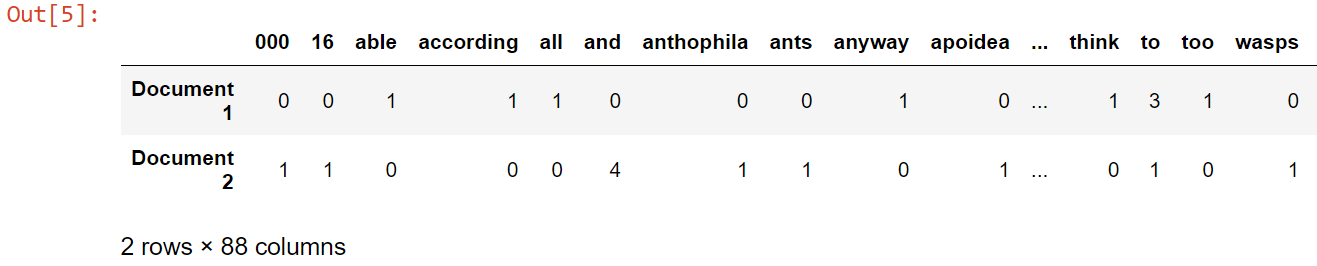
Now that we've got these text vectors we can compare the similarities and differences of each one using a calculation called Term Frequency Inverse Document Frequency (TFIDF). I know that sounds very confusing but it's basically a way to measure how unique a certain word is relative to every other word in a document. This is calculated on a scale from 0–1 with the most common words approaching 0 and the most unique words approaching 1. Here's what that looks like for our bee documents:
Once we have this dataframe we just need to run the cosine_similarity function and we'll have our result

This means that according to Cosine Similarity, the first line of Bee Movie is only 19% similar to the first paragraph of the "Bee" Wikipedia page. This might seem low at first but let's compare the first document to something else to see the difference.

These two documents are only 7.6% similar which makes sense because the word "Bee" doesn't even appear once in the third document.
This process can easily get scaled up for larger documents which should create less room for statistical error in the calculation. If two 50-word documents are 50% similar it's likely because half of the words are "the", "to", "a", etc. But, when you have 50% similarity in 1000-word documents you might be dealing with plagiarism. Cosine Similarity is incredibly useful for analyzing text - as a data scientist, you can choose what % is considered too similar or not similar enough and see how that cutoff affects your results.
There are also other methods of determining text similarity like Jaccard's Index which is handy because it doesn't take duplicate words into account.
Cosine Similarity With Images
You can probably guess that this process is very similar to the one above. Luckily we don't have to do all the NLP stuff, we just need to upload the image and convert it to an array of RGB values. This process is pretty easy thanks to PIL and Numpy! For this example, I'll compare two pictures of dogs and then compare a dog with a frog to show the score differences.
Here are the two pictures of dogs I'll be comparing:
, Right image by Kevin Rojas on Pexels](https://assets.insightmediagroup.io/media/wp-content/uploads/2022/02/197Jxul-bw9FiVu2NHJgjPA.png)
And here is the code I used to upload the pictures and convert them to vectors:
To show you another method of calculating cosine similarity I'll be using Scipy and the spatial.distance function. Cosine distance and cosine similarity are calculated almost the same with one slight difference. This article by John R. Ladd does a great job of explaining the difference and how they relate to Euclidean distance as well, but for this example, all we need to know is that

Now that we know this, we can just calculate cosine distance using Scipy and then convert it to cosine similarity. Here's how I did that:

This means those dog pictures are 81% similar which makes sense, just by looking at them you can tell they have basically the same subject and color palettes. What if we were to take a completely different image and compare it to the first dog picture? Something like this:
, Right image by Gleb Korovko on Pexels](https://assets.insightmediagroup.io/media/wp-content/uploads/2022/02/1RDwLHbXU0RI3mmpz6P_BPQ.png)

Just as expected, these two images are significantly less similar than the first two. 30% is still relatively high but that is likely the result of them both having large dark areas in the top left along with some small color similarities. Just like with the text example, you can determine what the cutoff is for something to be "similar enough" which makes cosine similarity great for clustering and other sorting methods.
It's also possible to use HSL values instead of RGB or to convert images to black and white and then compare - these could yield better results depending on the type of images you're working with. Whether you're trying to build a face detection algorithm or a model that accurately sorts dog images from frog images, cosine similarity is a handy calculation that can really improve your results!
Conclusion
I hope this article has been a good introduction to cosine similarity and a couple of ways you can use it to compare data. As data scientists, we can sometimes forget the importance of math so I believe it's always good to learn some of the theory and understand how and why our code works. Hopefully, you can take some of the concepts from these examples and make your own cool projects!
If you're interested in learning more about cosine similarity I HIGHLY recommend this youtube video. Or if you want to learn more about Natural Language Process you can check out my article on Sentiment Analysis. I'm also happy to cover more topics like this in the future, let me know if you're interested in learning more about a certain function, method, or concept.
Thank you for reading!
Want More From Me?
Support my writing by signing up for Medium using my referral link