
Dash is an open-source Python framework for building interactive web applications and data dashboards. It allows you to create responsive dashboards using Python without writing front-end code such as HTML, CSS, or JavaScript. Dash is widely used for data visualization, analytics, and machine learning applications.
Installation
Before creating Dash applications, install the library using the following command:
pip install dash
After installation, you can import Dash and start building interactive web applications using Python.
Creating a Basic Dashboard
In this example, we will create a simple Dash application that displays an interactive graph in a web browser.
Step 1: Import Required Libraries
Import the Dash library and the components required to build the dashboard.
from dash import Dash, html, dcc
Explanation:
- Dash creates the web application.
- html provides HTML components such as headings, paragraphs, and containers.
- dcc (Dash Core Components) provides interactive components such as graphs, dropdowns, sliders, and input fields.
Step 2: Create the Dashboard Layout
Define the application layout by adding a heading and a graph.
from dash import Dash, html, dcc
app = Dash(__name__)

app.layout = html.Div([
    html.H1("Basic Dash Dashboard"),

    dcc.Graph(
        id="sales-chart",
        figure={
            "data": [
                {
                    "x": [1, 2, 3, 4, 5],
                    "y": [5, 4, 7, 4, 8],
                    "type": "line",
                    "name": "Trucks"
                },
                {
                    "x": [1, 2, 3, 4, 5],
                    "y": [6, 3, 5, 3, 7],
                    "type": "bar",
                    "name": "Ships"
                }
            ],
            "layout": {
                "title": "Basic Dashboard"
            }
        }
    )
])
Explanation:
- Creates a Dash application using Dash(__name__).
- Uses html.Div() as the main container.
- Adds a page heading with html.H1().
- Uses dcc.Graph() to display an interactive chart.
- The figure dictionary defines: data - datasets to plot, x and y - axis values, type - chart type (line, bar, etc.), name: label displayed in the legend and layout: chart title and other layout settings.
Step 3: Run Dash Application
Start the local development server using the following code.
if __name__ == "__main__":
    app.run(debug=True)
Explanation:
- Starts the Dash development server.
- The debug=True option automatically reloads the application whenever the code changes.
- After running the script, open the following address in your web browser: http://127.0.0.1:8050/
Output
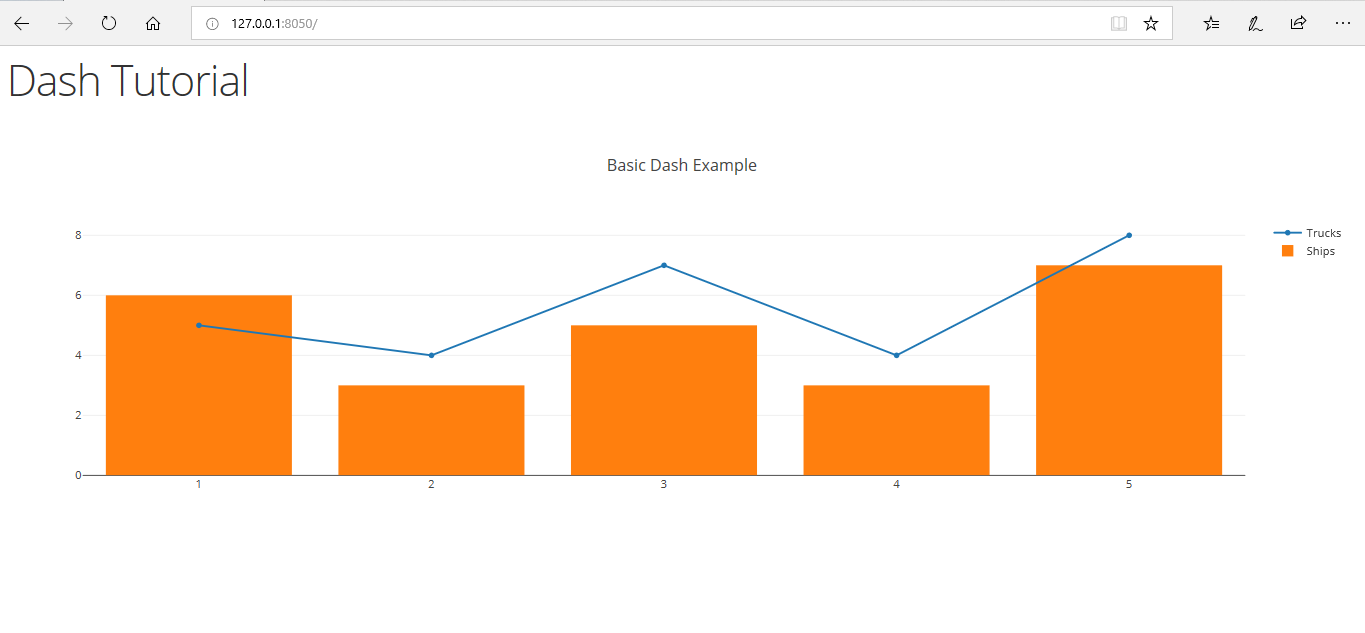
The dashboard opens in your browser and displays an interactive chart containing both a line graph and a bar chart.
Creating an Interactive Dashboard with Callbacks
Dash callbacks allow your application to respond to user interactions. In this example, the user enters a number, and the application automatically displays its square.
Step 1: Import the Required Libraries
Import Dash along with the callback components.
from dash import Dash, html, dcc, Input, Output
Explanation:
- Dash creates the application.
- html provides HTML components.
- dcc provides interactive components such as text boxes, dropdowns, and graphs.
- Input and Output are used to create callbacks that update components dynamically.
Step 2: Create the Dashboard Layout
Create a text input field and an area to display the result.
from dash import Dash, html, dcc, Input, Output
app = Dash(__name__)

app.layout = html.Div([
    dcc.Input(
        id="input-number",
        type="text",
        placeholder="Enter a number"
    ),

    html.Br(),
    html.Br(),
    html.Div(id="output")
])
Explanation:
- Creates a text input using dcc.Input().
- Uses the placeholder parameter to display a hint inside the input box.
- Adds a Div component where the calculated result will be displayed.
Step 3: Add a Callback
Create a callback that updates the output whenever the input value changes.
@app.callback(
    Output("output", "children"),
    Input("input-number", "value")
)
def update_value(value):
    try:
        number = float(value)
        return f"Square: {number ** 2}"
    except (TypeError, ValueError):
        return "Please enter a valid number."
Explanation:
- The callback is triggered whenever the value in the input box changes.
- Converts the entered value to a floating-point number.
- Calculates and displays its square.
- If the input is invalid, an appropriate error message is displayed.
Step 4: Run the Application
Start the Dash development server.
if __name__ == "__main__":
    app.run(debug=True)
Explanation:
- Starts the local Dash server.
- The debug=True option automatically reloads the application whenever the code is modified.
- Open the following URL in your browser after running the program: http://127.0.0.1:8050/
Output
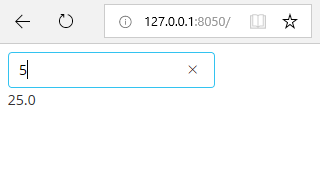
The application displays a text box where the user can enter a number. As soon as a valid number is entered, its square is calculated and displayed automatically using a Dash callback.
