
Every web developer relies on built-in Browser Developer Tools (DevTools) to inspect, debug, and optimize web pages through real-time interaction with HTML, CSS, JavaScript, network, performance, and accessibility features.
- Core functionality stays consistent across browsers while interfaces and advanced capabilities evolve rapidly.
- This guide focuses on Google Chrome and Mozilla Firefox (including Developer Edition), with strong support in Microsoft Edge.
How to open DevTools in the browser
There are many ways to open the Browser Developer Tools.
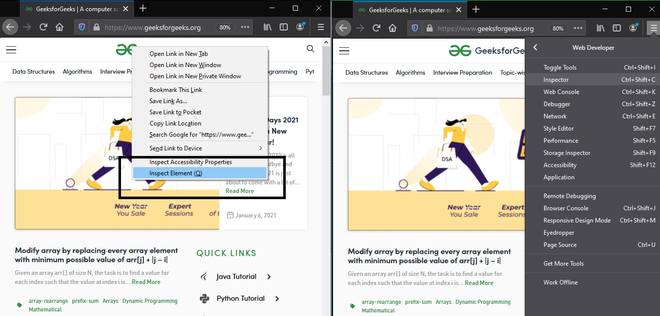
- To access the DOM or CSS of the webpage, right-click the desired element on the page and select Inspect. Or press Command+Option+C (Mac), Control+Shift+C/I (Windows, Linux, Chrome OS), or press F12 (Internet Explorer, Edge).
1. Inspector
This panel displays and allows editing of the live DOM and applied CSS. Changes are reflected instantly but are not persisted after refresh (use local overrides or workspaces for persistence).

- Edit HTML directly (text, attributes, structure).
- Live CSS editing with real-time previews, box model visualization, and grid/flex inspectors.
- Edit as HTML, Duplicate Node, Delete Node, Create Node.
- Force pseudo-classes (:hover, :active, :focus, etc.).
- Copy CSS selector, XPath, or full HTML.
- Changes panel to track modifications.
- Improved support for CSS at-rules, nesting, scroll-driven animations, and container queries.
- Accessibility overlays and role checking.
Application:
- Inspect and modify DOM/CSS in real time.
- Debug layouts, animations, and responsive design.
- Identify unused CSS (Coverage tool).
- Work with modern frameworks (React/Vue DevTools extensions integrate here).
2. Console
The Console is essential for JavaScript debugging. It logs errors, warnings, and messages from the page, and serves as a REPL (Read-Eval-Print Loop) for executing code live.

- View logged messages (console.log, etc.).
- Run JavaScript snippets or expressions.
- Preserve log across reloads.
- Filter by log level, group similar messages.
- Monitor XMLHttpRequests/Fetch, WebSockets.
- AI assistance (Chrome) Gemini integration for explaining errors, suggesting fixes, and code completion.
Application:
- Debug runtime issues.
- Test code snippets.
- Inspect variables and objects interactively.
3. Debugger(Firefox)/ Sources(Chrome)
This panel lets you inspect, debug, and edit JavaScript source files. Set breakpoints, step through code, watch variables, and inspect the call stack.
Structure
- Lists all loaded scripts and resources.
- Displays source with syntax highlighting; set breakpoints by clicking line numbers.
- Watch expressions, Breakpoints, Call Stack, Scopes.
- Local overrides and workspaces for editing files persistently.
- Snippets for reusable code.
- Enhanced debugging for Speculation Rules, adopted stylesheets.
- AI-powered assistance and code completion.
- Integration with DevTools for agents (AI coding assistants).
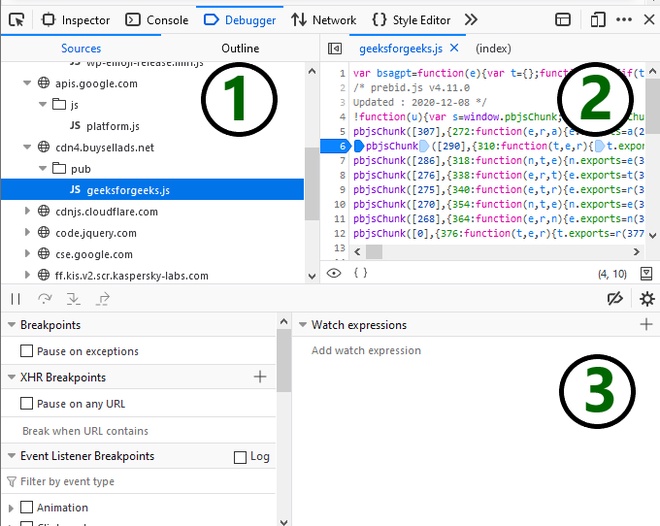
Application:
- Pause execution with breakpoints.
- Debug complex async code and frameworks.
- Find unused JavaScript (Coverage).
- Persist changes across reloads.
3. Network Monitor
Monitor all network requests and responses when loading or interacting with a page.
Key columns: Status (HTTP codes), Type, Initiator, Time, Size, Waterfall/Timeline.
Features:
- Inspect headers, response content, cookies, and timing.
- Throttle network speeds (including realistic mobile/3G/4G profiles) or simulate offline.
- Filter requests, record HAR files.
- WebSocket and Server-Sent Events inspection.
- Individual request overrides (in Chrome).

Application:
- Diagnose slow loading, large payloads, or failed requests.
- Performance analysis and caching checks.
- Security inspection (mixed content, etc.).
4. Performance Tools
Record and analyze runtime performance, including JavaScript execution, layout, painting, and rendering.
Key capabilities:
- Record traces with detailed flame charts and timelines.
- Live Metrics and Insights sidebar (powered by Lighthouse data).
- Core Web Vitals (LCP, CLS, INP) monitoring with real-user comparison (CrUX data).
- CPU/GPU throttling and mobile emulation.
- Identify bottlenecks in JS, CSS animations, and rendering.
- AI insights for recommendations.

Application:
- Optimize responsiveness and frame rates.
- Debug jank, memory leaks, and long tasks.
- Simulate real-world conditions.
5. Accessibility Inspector
Inspect the accessibility tree, roles, states, and properties exposed to assistive technologies.
Features:
- Tree view of the accessibility hierarchy.
- Simulate color blindness, contrast checks, keyboard navigation order.
- Highlighting and full-page tree view (Chrome).
- Integration with axe-core or similar in extensions

Applications:
- Application: Service workers, manifests, caches, IndexedDB, cookies, local/session storage.
- Issues: Consolidated warnings for console, accessibility, etc.
- Rendering: Emulate CSS media features, vision deficiencies, etc.
- Sensors / WebAuthn / Autofill: Device emulation and testing.
- DevTools for Agents: MCP server for AI coding agents to inspect, debug, and automate fixes directly.
Firefox offers strong alternatives like the Style Editor, Storage Inspector, and excellent multi-browser debugging via about debugging.
