Curve Sketching is a mathematical technique used to draw the approximate graph of a function by analyzing its properties and behavior. It provides a visual representation of the relationship between variables and helps in understanding how a function changes over its domain.
Identifies key graph features such as intercepts, maxima, minima, points of inflection, and asymptotes.
Helps analyze function behavior by showing where the function increases, decreases, or changes curvature.
Graphing Basics
To create a graph of any given function, we need to plot some points such as intercepts, critical points, and some regular points, which can help us trace the graph on the cartesian plane.
Plotting Points
We can easily plot various different points of any function on the graph by just using random input and their outputs as the coordinates. This random plot of points helps us connect the final graph after all the necessary calculations are done.
For example, we need to graph the function f(x) = ex, so just putting x = loge3 we get the output f(loge3) = 3. Now, we can (loge3, 3) as a point on the graph.
Domain and Range
First, analyze the function to check for its domain. We need to find out the points where the value of the function becomes undefined or is discontinuous.
For example, 1/x is not defined at x = 0. Log(x) is defined only at positive values of x.
Finding Intercepts and Asymptotes
Intercepts are the points where the graph cuts the coordinate axis, and to find the x-intercept, we put y = 0 and solve for x. Similarly, to find the y-intercept, we put x = 0 and solve for y.
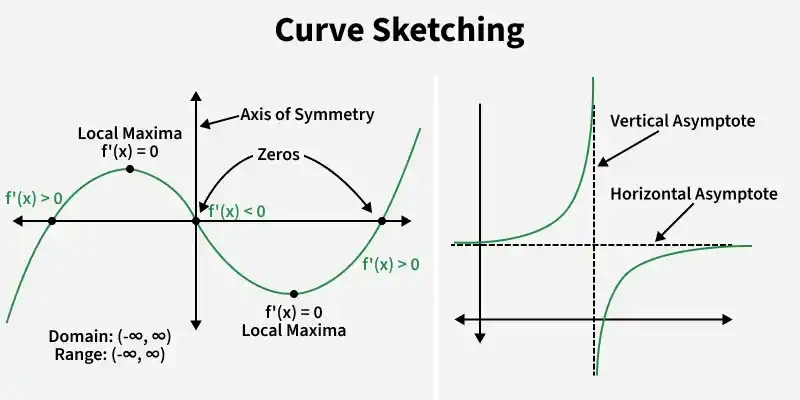
Asymptotes are lines that the graph approaches but do not intersect. There are three types of asymptotes, which are as follows:
To calculate Horizontal Asymptote, we need to calculate the limit of a function at infinity, and vertical asymptotes are those points for which functions become undefined, i.e., the denominator becomes 0.
Example: Find Intercept and Asymptote for f(x) = (2x + 1) / (x - 3).
Solution:
To find the x-intercept, we set f(x) = 0 and solve for x:
Therefore, the x-intercept of the function is at (-1/2, 0).
To find the y-intercept, we set x = 0 and solve for f(x):
⇒ f(0) = (2(0) + 1) / (0 - 3) = -1/3
Therefore, the y-intercept of the function is at (0, -1/3).
The vertical asymptote occurs at x = 3, since the denominator of the function becomes zero at that point.
To find the horizontal asymptote, we need to examine the behavior of the function as x approaches infinity or negative infinity. We can do this by dividing the numerator and denominator by the highest power of x in the function:
f(x) = (2x + 1) / (x - 3) = (2 + 1/x) / (1 - 3/x)
As x becomes very large or very small, the term 1/x becomes insignificant compared to the other terms in the numerator and denominator, so we can ignore it:
f(x) ≈ 2 / 1 = 2 (as x → ±∞)
Therefore, the horizontal asymptote of the function is y = 2.
Local Extrema and Inflection Points
Local Extrema are points on a function where the graph reaches a local maximum (peak) or a local minimum (valley) compared to the nearby points. These points help identify the turning points of a graph.
Critical points are points where the first derivative is zero or undefined, i.e., f'(x) = 0 or f'(x) does not exist.
Second derivative test:
If f''(x) > 0 at a critical point, the point is a local minimum.
If f''(x) < 0 at a critical point, the point is a local maximum.
If f''(x) = 0, the point may be an inflection point where the graph changes its concavity.
Inflection Point: Inflection point is the point where the concavity changes, i.e., the second derivative of the function = 0.
Calculating Slope and Concavity
Slope: Slope measures the steepness of a graph and indicates whether a function is increasing or decreasing at a particular point. It is calculated using the first derivative of the function.
Positive slope (> 0): The function is increasing.
Negative slope (< 0): The function is decreasing.
Concavity: Concavity describes the direction in which a curve bends and helps us understand the shape of the graph. It is determined using the second derivative of the function.
Positive second derivative (> 0): The graph is concave up.
Negative second derivative (< 0): The graph is concave down.
Example: Find the slope and concavity of f(x) = x3 - 3x2 + 2x.
Solution:
Given, f(x) = x³ - 3x² + 2x
First derivative: f'(x) = 3x² - 6x + 2
To find the slope at x = -1:
f'(-1) = 3(-1)² - 6(-1) + 2 = 3 + 6 + 2 = 11
Therefore, the slope of the function at x = -1 is 11.
For concavity, find the second derivative: f''(x) = 6x - 6
Set f''(x) = 0 to find possible inflection points: 6x - 6 = 0
x = 1
When x < 1, f''(x) < 0, so the graph is concave down. When x > 1, f''(x) > 0, so the graph is concave up.
Therefore, the function changes concavity at x = 1, and the inflection point is (1, 0).
Symmetry
Symmetry in curve sketching refers to a property where one part of a curve is a mirror image of another part. Checking symmetry helps in understanding the shape of a graph and makes sketching easier.
Symmetry about the y-axis (Even Function): If f(-x) = f(x), the graph is symmetric about the y-axis.
Symmetry about the origin (Odd Function): If f(-x) = -f(x), the graph is symmetric about the origin.
Symmetry about the x-axis: If replacing y by -y gives the same equation, the graph is symmetric about the x-axis. This type of symmetry is generally seen in relations rather than functions.
Tracing Different Types of Functions
Curve sketching helps us draw the graph of a function by studying its important properties. While simple functions are easy to sketch, more complex functions require careful analysis to understand their behavior and shape.
Linear Functions
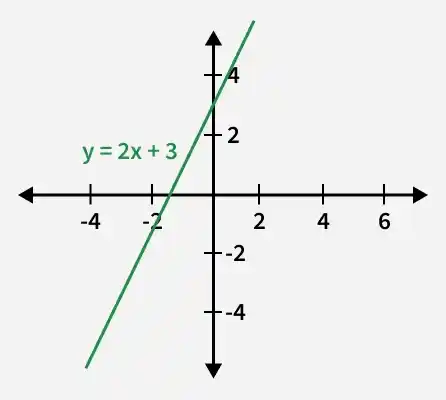
Sketching Linear Function is quite an easy task in curve sketching, as we just need two points on the graph, and the line joining those two points is the graph of a linear function. Let's consider an example:
Example: Sketch the graph for the function f(x) = 2x + 3.
Solution:
For f(x) = 2x + 3,
Put x = 0 ⇒ f(0) = 3
and Put x = 1 ⇒ f(1) = 5
Now, draw a striaght line passing throught the pionts (0, 3) and (1, 5) which is the graph of the linear function f(x) = 2x+3.
Polynomial Functions
Polynomial functions occur a lot in calculus, and it is essential to know how to sketch their graphs. We will look at a function and use the techniques studied above to infer the graph of the function. The general idea is to look for asymptomatic values and where they are going and then find the critical points and draw a graph according to them.
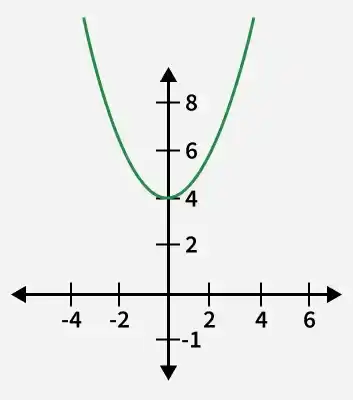
Example: Sketch the graph for the given function, f(x) = x + 4.
Solution:
We know that the domain of this function is all real numbers. This functions will tend to infinity as we go towards large positive and negative values of x.
Notice that f(-x) = (-x)2 + 4 = x2 + 4 = f(x). That is this function is even, so its graph must be symmetric about the y-axis.
Now we know that graph goes to infinity and is symmetrical around the y-axis. Now, let's look for critical points.
f'(x) = 2x = 0
⇒ x = 0
Thus, there is only one critical point which is x = 0. Checking the double derivative f''(x) = 2. Since f''(x) > 0 for every x. So, the graph must be convex upward everywhere with minima at x = 0. Now we just need to know the value of the function at minima.
f(0) = 4.
Now we are ready to plot a graph.
Exponential Functions
Exponential functions are an essential part of calculus and are commonly represented as f(x) = ax, where a is any positive constant and x can be any possible real number.
To sketch the graph of Exponential Functions we need to check the domain, range, and asymptotes. We also need to check whether the function is increasing or decreasing. If the base of the exponential function lies between 0 and 1, then it decreases in its domain; otherwise, it is an increasing function.
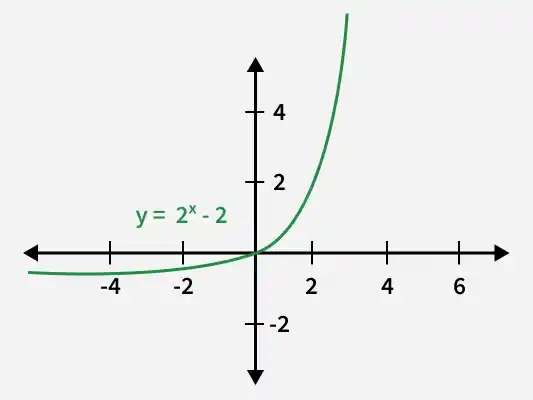
Example: Sketch the graph for the given function, f(x) = 2x - 1
Solution:
The domain of this function is all real numbers. As x goes to negative infinity, the function approaches zero, and as x goes to infinity, the function approaches infinity.
The base of the exponential function is 2, which is greater than one, so the function increases as x increases.
To find critical points, we need to find where the derivative is zero. f'(x) = 2x ln(2). This derivative is zero only when x = 0.
Thus, the critical point occurs at x = 0. To determine the concavity, we can find the second derivative of the function. f''(x) = 2x ln2(2). Since the second derivative is always positive, the graph must be convex upward everywhere.
Now we just need to find the value of the function at the critical point. f(0) = 20 - 1 = 0.
We can now use this information to sketch the graph of the exponential function.
Logarithmic Functions
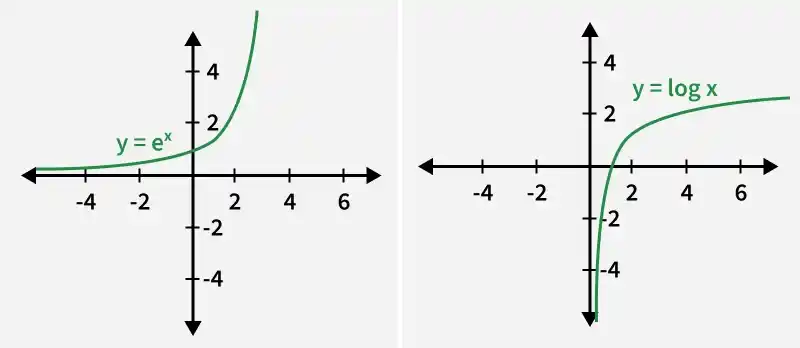
We know that logarithmic functions are the inverse of exponential functions. The function y = logbx is the inverse of y = bx. The graph of the exponential function is given below. We also know that the graph of an inverse of a function is basically a mirror image of the graph in y = x. So we can derive the shape of the graph of the log function from the given graph of the exponential function.
The mirror image of the Logarithmic function is the exponential function; both of them are shown in the image below.
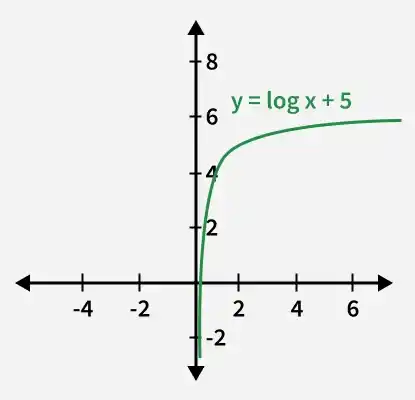
Example: Plot the graph for log₁₀ x + 5.
Solution:
We can see that the function is f(x) = log10x + 5.
The graph of this equation will be shifted 5 units in the upwards direction.
Sample Problems
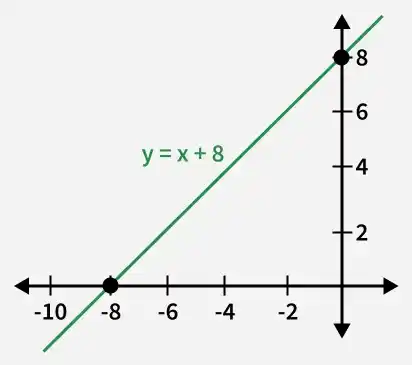
Problem 1: Sketch the graph for the given function, f(x) = x + 8.
Solution:
We know that the domain of this function is all real numbers. This functions will tend to infinity as we go towards large positive and negative values of x.
Now we know that graph goes to positive infinity for larger positive values of x and negative infinity for larger negative values of x.Now, let's look for critical points.
f'(x) = 1
There is no critical point, that means derivatives change sign remains same and constant throughout.
Let's see where the equation cuts the x-axis.
x+ 8 = 0
⇒x = -8
Now we are ready to plot a graph.
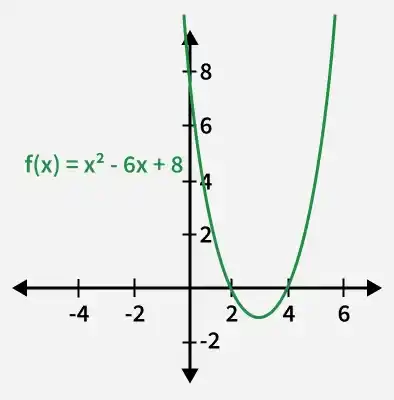
Problem 2: Sketch the graph for the given function, f(x) = x² - 6x + 8.
Solution:
We know that the domain of this function is all real numbers. This functions will tend to infinity as we go towards large positive and negative values of x.
Now we know that graph goes to positive infinity for larger positive values of x and negative infinity for larger negative values of x.Now, let's look for critical points.
f'(x) = 2x -6 = 0 ⇒x = 3
There is one critical point, that means derivatives change sign at that, but we don't know which sign changes to what. So, we will check the sign.
From x ∈ (-∞,3] f'(x) < 0. That is in this interval, the graph is decreasing.
From x ∈ (3,∞) f'(x) > 0. That is in this interval, the graph is increasing.
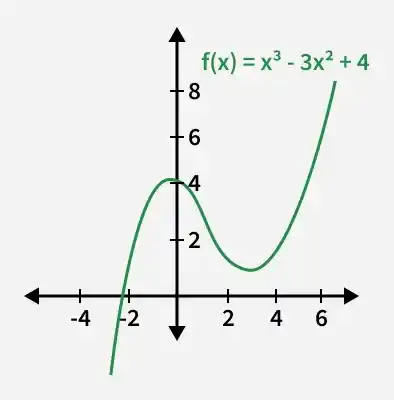
Problem 3: Sketch the graph for the given function, f(x) = x - 3x + 4.
Solution:
We know that the domain of this function is all real numbers. This functions will tend to infinity as we go towards large positive and negative values of x.
Now we know that graph goes to positive infinity for larger positive values of x and negative infinity for larger negative values of x.Now, let's look for critical points.
f'(x) = 3x2 -3 = 0 ⇒x2 = 1 ⇒x = -1 or 1
There are two critical points, that means derivatives change sign at them, but we don't know which sign changes to what. So, we will check the sign.
From x ∈ (-∞,-1] f'(x) > 0. That is in this interval, the graph is increasing.
From x ∈ (-1,1] f'(x) < 0. That is in this interval, the graph is decreasing.
From x ∈ (1,∞) f'(x) > 0. That is in this interval, the graph is increasing.
f(0) = 4.
Now we are ready to plot a graph.
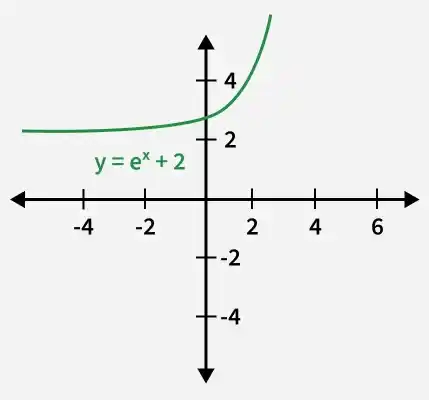
Problem 4: Plot the graph for the equation f(x) = eˣ + 2.
Solution:
We know that f(x) = ex + 2 is an exponential function, it increases with increasing value of x.
f'(x) = ex
This will never become zero, so there are no critical points. The graph is continuously increasing.
f''(x) > 0 thus it's shape is always convex upward. Due to the addition of 2 to the exponential function. The whole graph will be shifted two units upwards.