
An outlier is a data value that is significantly different from the other values in a dataset.
- It may be much higher or much lower than the rest of the observations
- Can indicate unusual variation, errors, or rare events in the data.
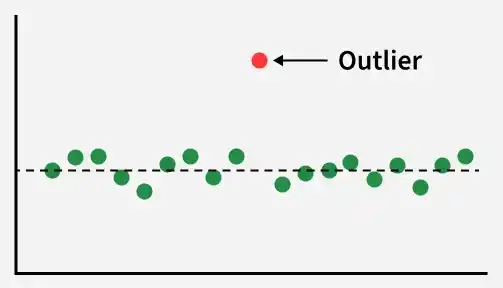
The red point represents an outlier because it lies far away from the other data points and does not follow the overall pattern of the dataset. This unusual value may indicate an error, a rare event, or an exceptional observation.
Outlier Formula (Tukey Method)
Outliers can be identified using Tukey's Method, which is based on the Interquartile Range (IQR).
- IQR = Q₃ − Q₁
- Upper Fence = Q₃ + 1.5 × IQR
- Lower Fence = Q₁ − 1.5 × IQR
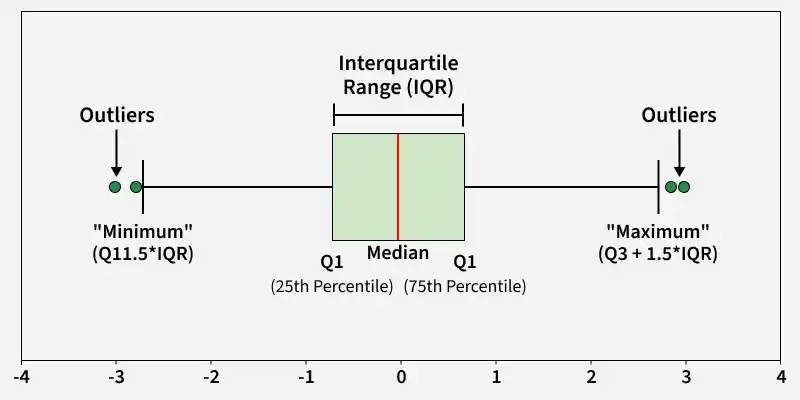
where:
- Q₁ = First Quartile (25th Percentile)
- Q₃ = Third Quartile (75th Percentile)
- IQR = Interquartile Range
Any data point that falls above the Upper Fence or below the Lower Fence is considered an outlier.
Examples
Example 1: Dataset: 10, 12, 14, 16, 18, 500
Solution:
Outlier Calculation: Using the IQR method,
Q1 = 12, Q3 = 18
IQR = Q3 - Q1 = 6
Lower Bound = Q1 - 1.5 * IQR = 3
Upper Bound = Q3 + 1.5 * IQR = 27
The value 500 is an outlier.
Example 2: Dataset: 20, 22, 24, 26, 28, 30
Solution:
Outlier Calculation: Using Z-score,
Mean = 25, Standard Deviation = 4
Z-score for 30 = (30 - 25) / 4 = 1.25
The value 30 is not an outlier.
Types of Outlier
Outliers can be classified into two types based on how far they lie from the main distribution of the dataset.
1. Mild Outlier
A mild outlier is a data point that is moderately different from the rest of the observations. It lies beyond 1.5 × IQR but within 3 × IQR from the quartiles.
Condition:
- Below: Q₁ − 1.5 × IQR
- Above: Q₃ + 1.5 × IQR
Example: If Q₁ = 10, Q₃ = 20, and IQR = 10, then values between 35 and 50 are considered mild outliers.
2. Extreme Outlier
An extreme outlier is a data point that lies very far from the rest of the dataset. It occurs beyond 3 × IQR from the quartiles.
Condition:
- Below: Q₁ − 3 × IQR
- Above: Q₃ + 3 × IQR
Example: If Q₁ = 10, Q₃ = 20, and IQR = 10, then any value greater than 50 is considered an extreme outlier.
Example: Let's find the outliers in the following dataset using the IQR method: 10, 12, 14, 16, 18, 500.
Solution:
Calculate Quartiles:
- Q1 = 12, Q3 = 18
Calculate IQR:
- IQR = Q3 - Q1 =18−12=6
Determine Outlier Bounds:
- Lower Bound: Q1 - 1.5 × IQR = 12−1.5×6=3
- Upper Bound: Q3 + 1.5 × IQR =18+1.5×6=27
Identify Outliers:
- The value 500 is above the upper bound of 27, so it is considered an outlier.
By using the IQR method, we identified that the value 500 is an outlier in the given dataset.
Causes of Outliers
Outliers can occur due to several reasons. The most common causes are:
1. Data Entry Errors: Mistakes made while entering or recording data can create unusual values in a dataset.
Example: Recording a person's height as 16 feet instead of 6 feet.
2. Sampling Variability: Natural differences among individuals or observations may produce values that are unusually high or low compared to the rest of the data.
Example: A study may include a few exceptionally tall or short individuals.
3. Measurement Errors: Faulty instruments, improper calibration, or mistakes during measurement can result in inaccurate data values.
Example: A defective thermometer recording incorrect temperatures.
4. Genuine Anomalies: Some outliers represent real and unusual observations rather than errors. These values may reveal important patterns or rare events.
Example: An unusually high sales figure during a special promotional event.
Uses of Outliers
Outliers are useful for identifying unusual patterns and improving data analysis. Some common uses are:
- Anomaly Detection: Helps identify unusual or unexpected patterns in data.
- Quality Control: Detects defects, errors, or irregularities in products and processes.
- Financial Analysis: Helps detect fraudulent activities and abnormal transactions.
- Predictive Modeling: Improves the accuracy and reliability of machine learning and statistical models by properly handling outliers.
Outliers vs Inliers
The difference between Outliers and Inliers are tabulated below:
Outliers | Inliers |
|---|---|
A data point that differs significantly from other observations in a dataset | An uncommon or incorrect observation within a dataset, harder to detect than outliers |
Can skew statistical analyses and lead to misleading results | Harder to identify and may require external data for detection |
Can indicate measurement error, experimental variability, or genuine anomalies | Caused by measurement error or incorrect observations within the dataset |
Identified using methods like IQR and Z-score, which compare data points to assumed distributional forms | More challenging to detect as they are in the interior of the distribution where most data occurs |
Outliers caused by measurement error should be removed, while those indicating novel behavior may warrant further investigation | If identified as erroneous, inliers can be deleted from the dataset |
