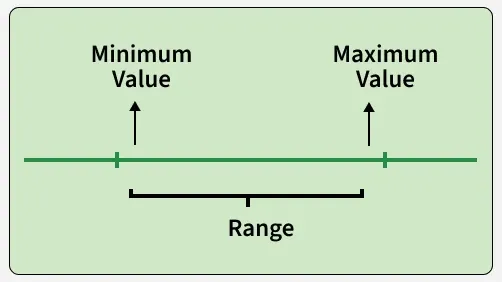
The range is the difference between the highest and lowest values in a dataset. It is one of the simplest measures of dispersion (spread) and helps us understand how widely the data values are distributed.
Range
Range Formula
Range = Maximum Value - Minimum Value
This simple formula provides a quick way to quantify the spread of data.
Steps to Find the Range
Identify the maximum value (the largest value) in your dataset.
Identify the minimum value (the smallest value) in your dataset.
Subtract the minimum value from the maximum value to find the range.
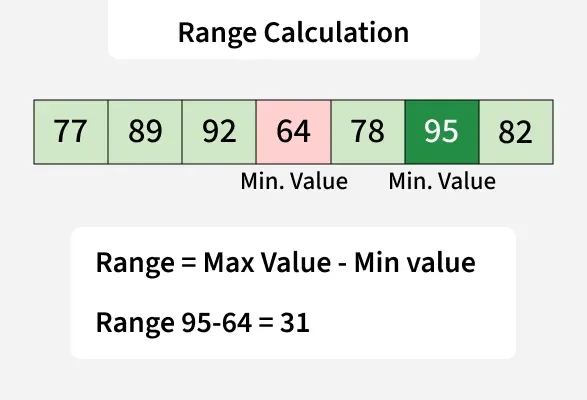
Example: Consider the following dataset of exam scores for a class tenth: 77, 89, 92, 64, 78, 95, 82. Find the Range.
Solution:
Now To Calculate the range
Here, Select The Largest Score as Maximum Value and Smallest score as Minimum Value:
Range Calculation
Maximum value = 95 Minimum value = 64 Range = 95 - 64 = 31
So, the range of the exam scores in this dataset is 31.
Range for Grouped Data
In Grouped data where the datasets are arranged in Class Intervals, the Range is find by subtracting the lower limit of the first class interval and the upper limit of the last class interval.
Class Interval
Frequency
0-10
12
10-20
10
20-30
15
30-40
13
40-50
11
Range = Upper Limit of the Last Class Interval - Lower Limit of First Class Interval = 50-0 = 50
Applications of Range
The range is widely used in different fields to measure the spread or variability of data. Some important applications are:
Data Analysis: Helps in understanding the variation and dispersion within a dataset.
Education: Used to analyze the spread of students' scores and evaluate performance differences.
Medical Research: Helps researchers study the range of outcomes of treatments or medications to assess their effectiveness and possible side effects.
Sports Analytics: Used to evaluate variations in players' performances over different games or seasons.
Economics and Finance: Assists in analyzing fluctuations in prices, incomes, profits, and other economic indicators.
Scientific Studies: Helps compare the spread of experimental observations and measurements across different conditions.