
Standard Normal Distribution (Z-distribution) is a normal distribution with a mean (μ) of 0 and a standard deviation (σ) of 1. In other words, a standard normal distribution satisfies the following:
- Mean (μ) = 0
- Standard Deviation (σ) = 1
- Total area under the curve = 1
It is commonly denoted by Z∼N(0,1), where Z represents the standard normal random variable.
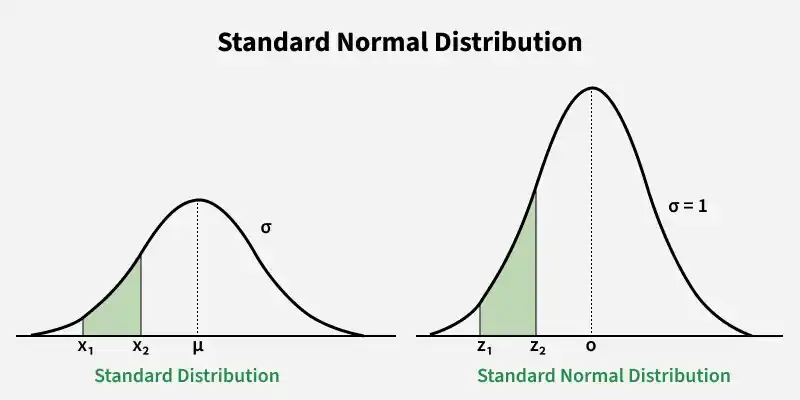
The probability density function (PDF) of the standard normal distribution is:
f(z)=\frac{1}{\sqrt{2\pi}}e^{\frac{-z^2}2}
Where:
- e is Euler's number (≈ 2.718)
- π ≈ 3.1416
- z is the standardized variable
This formula describes the shape of the standard normal curve.
Standard normal distribution is defined by the following characteristics:
- Symmetry: It is symmetric around the mean (μ = 0).
- Bell-Shaped Curve: The graph is bell-shaped, that means most values cluster around the mean (μ = 0).
- Total Area Under Curve: The total area under the curve is 1, representing the total probability.
- 68-95-99.7 Rule: Approximately 68% of data falls within 1 standard deviation of the mean, 95% within 2 standard deviations, and 99.7% within 3 standard deviations.
- Asymptotic: The tails of the distribution approach, but never touch, the horizontal axis.
- Unimodal: It has a single peak at the mean (μ = 0).
- Standard Scores (Z-Scores): Any normal distribution can be transformed into the standard normal distribution using z-scores where z = (x - μ)/σ.
Standard Normal Distribution Table
Standard Normal Distribution Z Table is the table of z-value for standard normal distribution where Z = [(x-μ)/σ]. The Standard Normal Distribution Z Table is given as follows:
Z-Value | 0 | 0.01 | 0.02 | 0.03 | 0.04 | 0.05 | 0.06 | 0.07 | 0.08 | 0.09 |
|---|---|---|---|---|---|---|---|---|---|---|
0 | 0.5000 | 0.5040 | 0.5080 | 0.5120 | 0.5160 | 0.5199 | 0.5239 | 0.5279 | 0.5319 | 0.5359 |
0.1 | 0.5398 | 0.5438 | 0.5478 | 0.5517 | 0.5557 | 0.5596 | 0.5636 | 0.5675 | 0.5714 | 0.5753 |
0.2 | 0.5793 | 0.5832 | 0.5871 | 0.5910 | 0.5948 | 0.5987 | 0.6026 | 0.6064 | 0.6103 | 0.6141 |
0.3 | 0.6179 | 0.6217 | 0.6255 | 0.6293 | 0.6331 | 0.6368 | 0.6406 | 0.6443 | 0.6480 | 0.6517 |
0.4 | 0.6554 | 0.6591 | 0.6628 | 0.6664 | 0.6700 | 0.6736 | 0.6772 | 0.6808 | 0.6844 | 0.6879 |
0.5 | 0.6915 | 0.6950 | 0.6985 | 0.7019 | 0.7054 | 0.7088 | 0.7123 | 0.7157 | 0.7190 | 0.7224 |
0.6 | 0.7257 | 0.7291 | 0.7324 | 0.7357 | 0.7389 | 0.7422 | 0.7454 | 0.7486 | 0.7517 | 0.7549 |
0.7 | 0.7580 | 0.7611 | 0.7642 | 0.7673 | 0.7704 | 0.7734 | 0.7764 | 0.7794 | 0.7823 | 0.7852 |
0.8 | 0.7881 | 0.7910 | 0.7939 | 0.7967 | 0.7995 | 0.8023 | 0.8051 | 0.8078 | 0.8106 | 0.8133 |
1 | 0.8413 | 0.8438 | 0.8461 | 0.8485 | 0.8508 | 0.8531 | 0.8554 | 0.8577 | 0.8599 |
Area of Standard Normal Distribution
The table given above is used to calculate the "Area of Standard Normal Distribution" curve. It is basically used to find the area from -∞ to Z. So we can say
F(Z) = Area Under Standard Normal Distribution from -∞ to Z
where,
- F stands for cumulative (or collected) area
- F(Z) is calculated using the table
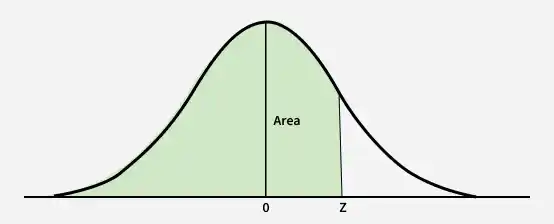
We simply need to find the value corresponding the required Z - value and that is equal to F(Z).
- Case 1: If we need to calculate the area from -∞ to Z, then the area is calculated as F(Z).
For example, for Z < 1, area is -∞ to 1 and this is equal to F(1) found from table which is equal to 0.8413.
- Case 2: If we need to calculate the area from Z to +∞, then the area is calculated as 1 - F(Z).
For example,for Z > 1, area is 1 to +∞ and this is equal to 1-F(1) found from table which is equal to 1-0.8413=0.1587.
- Case 3: If we need to calculate the area from -Z to +Z, then the area is calculated as F(Z) - F(-Z) (where F(-Z) is calculated as 1-F(Z) due to symmetry ) or we can simply calculate 2F(Z) - 1.
For example, for -1<Z<1, area is -1 to +1 and this is equal to F(1) - F(-1) = 2F(1)-1 found from table which is equal to 2(0.8413)-1=0.6826.
Since standard normal distribution curve is symmetric about the mean, the area under the curve to the left of a negative z-value is the same as the area to the right of the corresponding positive z-value. To find probability, look up the area to the right of the corresponding positive z-value and subtract it from 1. Therefore F(-Z) = 1 - F(Z).
Applications
Standard Normal Distribution has a wide range of applications and usage in several fields. Here are some important applications:
- Hypothesis Testing: Performing Z-tests and constructing confidence intervals.
- Probability Calculations: Determining standard normal distribution density probabilities and areas under the curve.
- Data Analysis: Standardizing scores (z-scores) and making suitable analysis.
- Quality Control: Monitoring processes using control charts.
- Risk Management: Calculating financial risks like Value at Risk (VaR).
- Machine Learning: Normalizing features to improve algorithm performance.
➣Practice: Solved Examples
