
A stem-and-leaf plot is a simple way to organize and display numerical data. In this method, each data value is divided into two parts:
- Stem – the leading digit(s)
- Leaf – the last digit
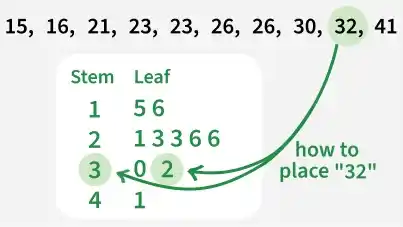
The stem values are written in a vertical column, and the corresponding leaf values are placed beside them in ascending order.
Steps to Create Stem and Leaf Plots
Step 1: Arrange the data values in ascending order.
Step 2: Separate each number into a stem and a leaf. The stem consists of the leading digit(s), and the leaf is the last digit.
Step 3: Determine the range of the data by identifying the smallest and largest values.
Step 4: Draw a vertical line to create two columns. Write Stem on the left side and Leaf on the right side.
Step 5: List all stem values in the left column in ascending order.
Step 6: Write the corresponding leaf values next to each stem.
Step 7: Arrange the leaf values for each stem in ascending order to complete the plot.
Reading Data from a Stem and Leaf Plot
To read a stem and leaf plot, combine each stem value with its corresponding leaf value to form the original data values.
The stem and leaf plot shown in the figure can be read as follows:
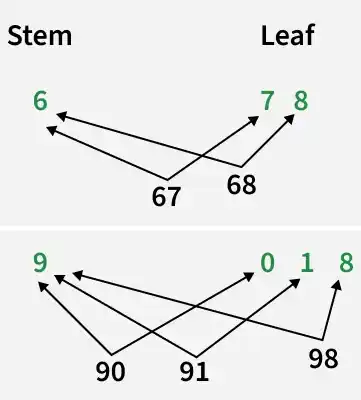
- 6 | 7 = 67
- 6 | 8 = 68
- 9 | 0 = 90
- 9 | 1 = 91
- 9 | 8 = 98
Therefore, the data values represented in the plot are: 67, 68, 90, 91, and 98.
Stem and Leaf Plot With Decimals
A stem and leaf plot can also be used to represent decimal values. In this case, the stem represents the whole number part, and the leaf represents the digit after the decimal point.
Example: Consider the following long jump distances (in meters):
2.3, 2.5, 2.5, 2.7, 2.8, 3.2, 3.6, 3.6, 4.5, 5.0
The stem and leaf plot for the data is shown below:
| Stem | Leaf |
|---|---|
| 2 | 3 5 5 7 8 |
| 3 | 2 6 6 |
| 4 | 5 |
| 5 | 0 |
Note:
- The stem represents the whole number part.
- The leaf represents the tenths digit.
- For example, 5 | 0 = 5.0 and 2 | 3 = 2.3.
Solved Examples
Example 1. A school teacher measured the heights (in cm) of the students in a classroom. The values are given below.
152, 157, 165, 168, 158, 172, 179, 175, 185, 188, 192, 190
Draw a stem-and-leaf diagram to represent the given data.
Solution:
The given data values are 152, 157, 165, 168, 158, 172 , 179, 175, 185, 188, 192, 190
Here, first two digits are the stem and the last digit is leaf.
As example, 152 = 15 I 2 (15 stem and 2 leaf).
We can get the data in ascending order such as :
152, 157, 158, 165, 168, 172, 175, 179, 185, 188, 190, 192.
Now, place this data values in a tabular form or a stem and leaf diagram.
Stem
Leaf
15
2, 7, 8
16
5, 8
17
2, 5, 9
18
5, 8
19
0, 2
Example 2. Given below is the stem and leaf plot:
Stem | Plot |
|---|---|
1 | 0, 3, 7 |
2 | 2, 5 |
3 | 1 |
4 | 5, 8 |
a) What are the data values of stem 4?
b) How many values are less than 17?
Solution:
a) The corresponding leaf values of stem 4 are 5 and 8.
So, the data values of stem 4 are 45 and 48.
b) The corresponding leaf values of stem 1 are 0, 3 and 7.
The data values of stem 1 are 10, 13 and 17.
10 and 13 are the less values than 17.
Therefore, the two values are less than 17.
Practice Problems
Problem 1: Construct a stem and leaf plot for the following data set:
56, 59, 61, 62, 65, 68, 71, 72, 75, 78
Problem 2: Given the stem and leaf plot, reconstruct the original data set:
| Stem | Leaves |
|---|---|
| 4 | 1, 2, 5, 8 |
| 5 | 0, 3, 4, 7 |
| 6 | 2, 4, 5, 9 |
Problem 3: Create a stem and leaf plot for the following data:
33.1, 34.5, 35.0, 36.8, 37.3, 38.2, 39.7, 40.5, 41.1
Problem 4: Create a stem and leaf plot for the following data set:
103, 105, 107, 109, 112, 115, 118, 121, 124, 127
