
Mean (in statistics) is the average of a set of numbers. It is one of the most important measures of central tendency in distributed data.
- To calculate the mean, add all the values in the data set and then divide the total by the number of values.
- The mean is usually denoted by x̄ (read as “x bar”).
Formula
The mean formula in statistics is defined as the sum of all observations in the given dataset divided by the total number of observations.
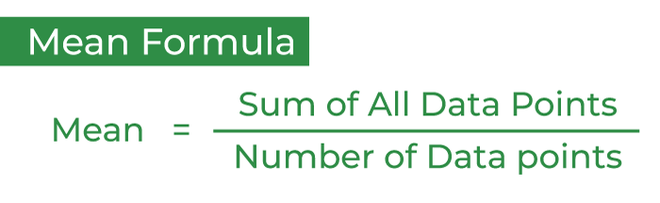
Example: Calculate the mean of the first 10 natural numbers.
Solution:
First 10 natural numbers = 1, 2, 3, 4, 5, 6, 7, 8, 9, 10
Sum of first 10 natural numbers = (1 + 2 + 3 + 4 + 5 + 6 + 7 + 8 + 9 + 10)
Mean = Sum of 10 natural numbers/10
⇒ Mean = (1 + 2 + 3 + 4 + 5 + 6 + 7 + 8 + 9 + 10)/10
⇒ Mean = 55/10
⇒ Mean = 5.5
How to Find the Mean?
To find the mean of a dataset, it's important to first determine whether the data is grouped or ungrouped, as the method of calculation differs for each.
Mean of Ungrouped Data
Ungrouped data is raw data that is not organized into any groups or intervals. These are individual observations listed as they are.
For ungrouped data, the mean is found by adding all individual values and dividing by the total number of observations.
Formula:
\bold{\bar{x} = \frac{x_1 + x_2 + x_3 +...x_n}{n}} \bold{\bar{x} = \frac{\sum{x_i}}{{n}}}
Example: Heights of 10 students: 142, 145, 150, 152, 148, 149, 151, 147, 146, 150
- Sum of heights = 1,480
- Number of students = 10
xˉ = 1480/10 = 148 cm
So, the mean height of the 10 students is 148 cm.
Mean with Frequency Distribution
Let's assume there are n number of items in a set, i.e., {x1, x2, x3, ... xn}, and the frequency of each item is given as {f1, f2, f3, . . ., fn}. Then, the mean is calculated using the formula:
\bold{\bar{x} = \frac{f_1x_1 + f_2x_2 + f_3x_3 +...f_nx_n}{f_1+f_2+f_3...f_n}}
\bold{\bar{x} = \frac{\sum{f_ix_i}}{{\sum{f_i}}}} OR
\bold{\bar{x} = \frac{\sum{f_ix_i}}{{\sum{f_i}}}}
Mean of Grouped Data
Grouped data is data that has been organized into groups (classes or intervals) to make it easier to understand and analyze, especially when the data set is large.
To represent grouped data, we use a frequency distribution table, which shows how many observations fall into each interval.
The mean of grouped data can be calculated using three methods:
- Direct Method: Mean of grouped data using class marks and their corresponding frequencies.
- Assumed Mean Method: Simplifies calculations by taking a convenient value as the assumed mean.
- Step Deviation Method: Further simplifies calculations by using scaled deviations of class marks.
Types of Mean
In statistics, there are four types of mean:
- Arithmetic Mean: Obtained by dividing the sum of all observed values by the total number of observations.
- Geometric Mean: The nth root of the product of all values in the dataset.
- Harmonic Mean: Calculated by dividing the number of observations by the sum of the reciprocals of the values.
- Weighted Mean: Calculated by assigning weights to values according to their importance and then finding the average.
Note: When not specified, the mean is generally referred to as the arithmetic mean.
➢Practice: Solved Examples
