

The mode is the value that appears most frequently in a data set. To determine the mode, count how frequently each number appears. Mode can be calculated for both numerical and categorical data. It is symbolized as Z or M₀..
A data set can have:
- One mode → Unimodal
- More than one mode → Bimodal / Multimodal
- No mode → when no value repeats
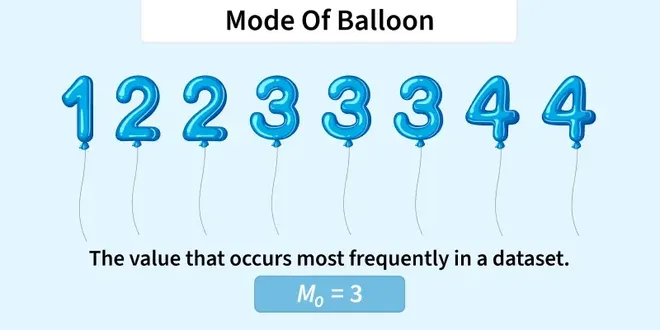
Example: In the given set of data of balloons: 1, 2, 2, 3, 3, 3, 4, 4, the mode of the data set is 3, since it has appeared in the set three times.
Types of Mode in Statistics
Depending upon the number of modal solutions, mode is classified into the following categories:
| Type | Definition | Example Data Set | Modes |
|---|---|---|---|
| Unimodal | When there is only one and only one mode in a dataset. | Set X = {1, 2, 2, 3, 6, 7, 7, 7, 8, 9} | Only 7 |
| Bimodal | When there are two modes in the given data set. | Set A = {1, 1, 1, 3, 4, 4, 6, 6, 6} | 1 and 6 |
| Trimodal | When there are three modes in the given data set. | Set A = {2, 2, 2, 3, 4, 4, 6, 6, 6, 7, 9, 9, 9} | 2, 6, and 9 |
| Multimodal | When there are four or more modes in the given data set. | Set A = {1, 1, 1, 3, 4, 4, 6, 6, 6, 7, 9, 9, 9, 11, 11, 11} | 1, 6, 9, and 11 |
Mode for Ungrouped Data
In case of ungrouped data we can simply find the mode by finding the most frequent observation.
Example : For this data 8, 7, 8, 6, 7, 7, 10, 8, 9, 7, 8, 8, 8, 7, 7, 7, 9, 8, 7, 7, 10, 7, 8, 8, 7, 8, 7, 8, 8, 8, 6, 7 the mode for this data is 8 as it is the most frequent value.
How to Calculate Mode of Ungrouped Data
To find the mode of ungrouped data:
- Arrange the data in ascending or descending order.
- Identify the value(s) that occur most frequently.
- The value with the highest frequency is the mode.
- If multiple values share the highest frequency, the data is multimodal.
Example: Find the mode in the given set of data: 4, 6, 8, 16, 22, 24, 41, 24, 42, 24, 15, 13, 61, 24, 29.
Solution:
Arrange the given set of data in ascending order, 4, 7, 8, 13, 15, 16, 22, 24, 24, 24, 24, 29, 41, 42, 61. The mode of the data set is 24 as it appeared in the given most.
Example : Imagine a shoe store that tracks the sizes of shoes sold over a month. The sizes are recorded as: 6, 7, 8, 7, 9, 7, 8, 8, 7, 6, 7, 8, 8, 7, 8, 8, 9, 8, 7, 8, 6, 7, 7, 10, 8, 9, 7, 8, 8, 8, 7, 7, 7, 9, 8, 7, 7, 10, 7, 8, 8, 7, 8, 7, 8, 8, 8, 6, 7, 9, 8, 7, 6, 8, 8, 7, 7, 9, 8, 10, 7, 7, 7, 8, 8, 7, 7, 6, 8, 8, 9, 7, 7, 8, 10
Solution:,
- Size 6: 6 times
- Size 7: 26 times
- Size 8: 27 times
- Size 9: 8 times
- Size 10: 4 times
Here, the most frequently sold shoe size is 8, which occurs 27 times. Therefore, the mode of this data set is 8.
Mode for Grouped Data
The mode for grouped data is calculated by using the formula :
\text{Mode} = L + \left( \frac{f_1 - f_0}{2f_1 - f_0 - f_2} \right) \times h
Where,
- L is the lower boundary of the modal class
- h is the size of the class interval,
- f1 is the frequency of the modal class,
- f0 is the frequency of the class preceding the modal class, and
- f2 is the frequency of the class succeeding the modal class.
How to Calculate Mode of Grouped Data
For grouped data, calculation of mode just by simple observation of frequency is not possible. To determine the mode of data in such cases we calculate the modal class and the Mode lies inside the modal class.
Modal Class
The modal class refers to the class interval (or group) in a frequency distribution or groped data that has the highest frequency. In other words, it’s the class with the most data points.
Example : In a frequency distribution of students' scores on a test, grouped into class intervals:
| Score Range (Class Interval) | Number of Students (Frequency) |
|---|---|
| 0 - 10 | 2 |
| 11 - 20 | 5 |
| 21 - 30 | 12 |
| 31 - 40 | 18 |
| 41 - 50 | 7 |
| 51 - 60 | 3 |
In this example, the class interval 31 - 40 has the highest frequency, with 18 students scoring within this range.
Therefore, 31 - 40 is the modal class.
Steps to Calculate Mode (Grouped Data)
- Create a frequency table with class intervals and their frequencies (if not provided).
- Identify the modal class.
- Note the values i.e., L , f1, f0, f2, and h.
- Apply the formula:
\text{Mode} = L + \left( \frac{f_1 - f_0}{2f_1 - f_0 - f_2} \right) \times h - Calculate and round the result as appropriate to the data context.
Example : Calculate the mode of the following data:
Class Interval | 10 - 20 | 20 - 30 | 30 - 40 | 40 - 50 | 50 - 60 |
|---|---|---|---|---|---|
Frequency | 5 | 8 | 12 | 9 | 6 |
Solution: To find the mode, we need to identify the class interval with the highest frequency. In this case, the class interval with the highest frequency is 30-40, which has a frequency of 12.
Modal class is 30-40
Lower limit of the modal class (l) = 30
Size of the class interval (h) = 10
Frequency of the modal class (f1) = 12
Frequency of the class preceding the modal class (f0) = 8
Frequency of the class succeeding the modal class (f2)= 9
Using these values in the formula
Mode = l + [(f1 - f0) / (2f1 - f0 - f2)]×h
⇒ Mode = 30 + [(12 - 8)/(2×12 - 8 - 9)] × 10
⇒ Mode = 30 + (4/7) × 10
⇒ Mode = 30 +40/7
⇒ Mode ≈ 30 + 5.71 = 35.71
So, the mode for this set of data is approximately 35.71.
Merits of Mode
- Represents the most frequent value in the dataset.
- Not affected by extreme or outlier values.
- Can be determined graphically.
- Suitable for open-ended class intervals.
- Simple and quick to compute, especially in ungrouped data.
Demerits of Mode
- May be undefined in case of multiple modes (bimodal or multimodal).
- Ignores values other than the most frequent.
- Affected by sampling fluctuations.
- No algebraic properties, unlike the mean.
- May be ill-defined in small or irregular datasets.
➢Practice: Solved Examples
