
A bar plot is used to compare values across different categories using rectangular bars. The height (or length) of each bar represents the corresponding value, making it easy to compare quantities between categories.
Example: The following example creates a simple bar plot to compare the sales of different fruits.
import matplotlib.pyplot as plt
import numpy as np

fruits = ['Apples', 'Bananas', 'Cherries', 'Dates']
sales = [400, 350, 300, 450]

plt.bar(fruits, sales)
plt.title('Fruit Sales')
plt.xlabel('Fruits')
plt.ylabel('Sales')
plt.show()
Output

Explanation: bar() function creates a vertical bar plot using the fruit names as categories on the x-axis and their corresponding sales values on the y-axis.
Syntax
matplotlib.pyplot.bar(x, height, width=0.8, color=None, label=None, align='center')
Parameters:
- x: Specifies the positions or category labels for the bars on the x-axis.
- height: Specifies the height (value) of each bar.
- width: Sets the width of the bars. The default value is 0.8.
- color: Specifies the color of the bars. It can be a single color or a list of colors.
- label: Adds a label for the bar plot, which can be displayed using legend().
- align: Specifies how the bars are aligned with the x positions. Common values are 'center' (default) and 'edge'.
Customizing Bar Colors
The color of the bars can be customized using the color parameter in the bar() function. This helps make the chart more visually appealing and easier to distinguish.
import matplotlib.pyplot as plt
import numpy as np

fruits = ['Apples', 'Bananas', 'Cherries', 'Dates']
sales = [400, 350, 300, 450]

plt.bar(fruits, sales, color='violet')
plt.title('Fruit Sales')
plt.xlabel('Fruits')
plt.ylabel('Sales')
plt.show()
Output
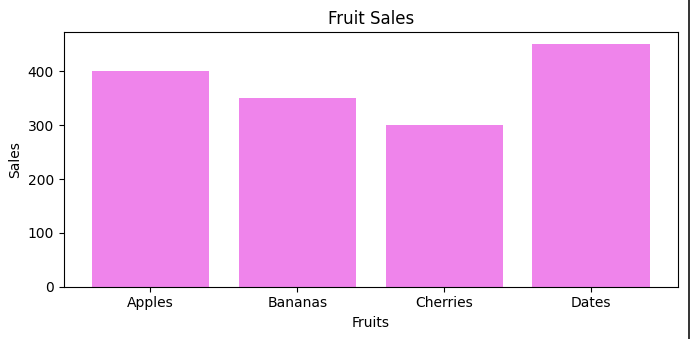
Explanation: color parameter sets the color of every bar in the chart. Here, all bars are displayed in violet.
Creating Horizontal Bar Plots
A horizontal bar plot displays categories along the y-axis and values along the x-axis. It is useful when category names are long or easier to read horizontally.
import matplotlib.pyplot as plt
import numpy as np

fruits = ['Apples', 'Bananas', 'Cherries', 'Dates']
sales = [400, 350, 300, 450]

plt.barh(fruits, sales)

plt.title('Fruit Sales')
plt.xlabel('Fruits')
plt.ylabel('Sales')
plt.show()
Output
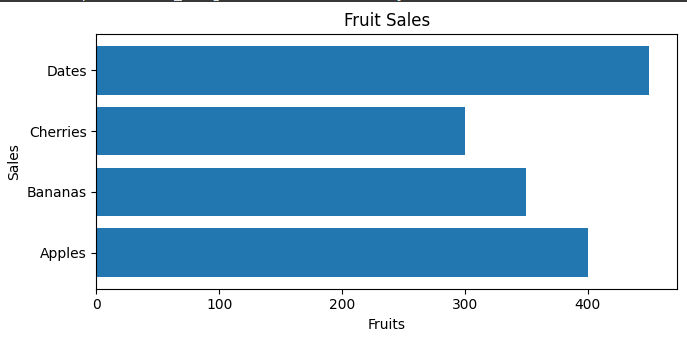
Explanation: barh() function creates horizontal bars, where categories are displayed on the y-axis and their corresponding values on the x-axis.
Adjusting Bar Width
The width of bars can be adjusted using the width parameter to make them narrower or wider based on the visualization requirements.
import matplotlib.pyplot as plt
import numpy as np

fruits = ['Apples', 'Bananas', 'Cherries', 'Dates']
sales = [400, 350, 300, 450]

plt.bar(fruits, sales, width=0.3)
plt.title('Fruit Sales')
plt.xlabel('Fruits')
plt.ylabel('Sales')
plt.show()
Output
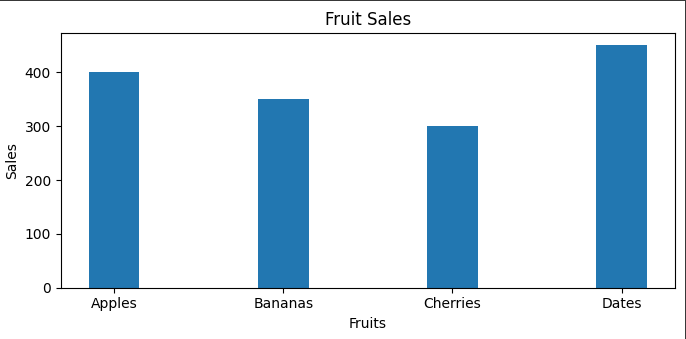
Explanation: width parameter controls the thickness of each bar. Smaller values create thinner bars, while larger values create wider bars.
Multiple Bar Plots
Multiple bar plots allow different datasets to be displayed side by side for each category, making comparisons easier.
import numpy as np
import matplotlib.pyplot as plt

barWidth = 0.25
fig = plt.subplots(figsize =(12, 8))

IT = [12, 30, 1, 8, 22]
ECE = [28, 6, 16, 5, 10]
CSE = [29, 3, 24, 25, 17]

br1 = np.arange(len(IT))
br2 = [x + barWidth for x in br1]
br3 = [x + barWidth for x in br2]

plt.bar(br1, IT, color ='r', width = barWidth,
        edgecolor ='grey', label ='IT')
plt.bar(br2, ECE, color ='g', width = barWidth,
        edgecolor ='grey', label ='ECE')
plt.bar(br3, CSE, color ='b', width = barWidth,
        edgecolor ='grey', label ='CSE')

plt.xlabel('Branch', fontweight ='bold', fontsize = 15)
plt.ylabel('Students passed', fontweight ='bold', fontsize = 15)
plt.xticks([r + barWidth for r in range(len(IT))],
        ['2015', '2016', '2017', '2018', '2019'])

plt.legend()
plt.show()
Output
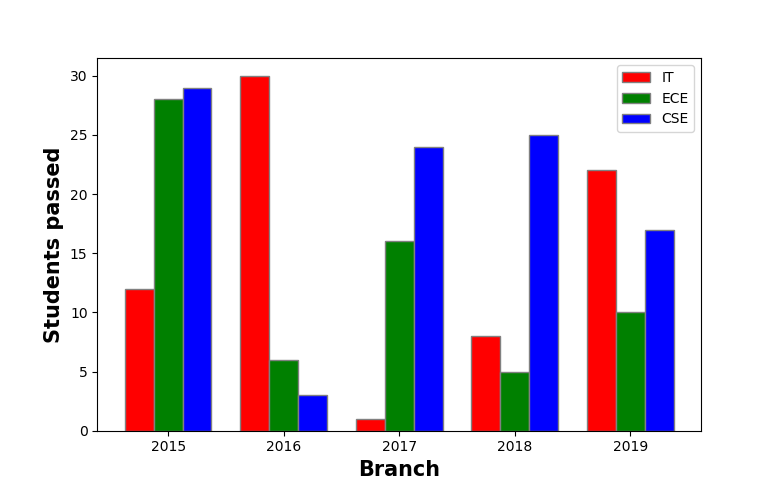
Explanation: bars for each category are shifted using different x-axis positions, allowing multiple datasets to be displayed side by side for comparison.
Stacked Bar Plot
A stacked bar plot displays multiple datasets by placing one bar on top of another, making it easy to compare both individual and total values.
import numpy as np
import matplotlib.pyplot as plt

N = 5

boys = (20, 35, 30, 35, 27)
girls = (25, 32, 34, 20, 25)
boyStd = (2, 3, 4, 1, 2)
girlStd = (3, 5, 2, 3, 3)
ind = np.arange(N)
width = 0.35

fig = plt.subplots(figsize =(10, 7))
p1 = plt.bar(ind, boys, width, yerr = boyStd)
p2 = plt.bar(ind, girls, width,
             bottom = boys, yerr = girlStd)

plt.ylabel('Contribution')
plt.title('Contribution by the teams')
plt.xticks(ind, ('T1', 'T2', 'T3', 'T4', 'T5'))
plt.yticks(np.arange(0, 81, 10))
plt.legend((p1[0], p2[0]), ('boys', 'girls'))

plt.show()
Output

Explanation: bottom parameter places the second set of bars on top of the first set, creating a stacked bar chart that represents both individual and total contributions.
