

Mahotas is an open-source Python library for image processing and computer vision. It provides efficient functions for reading, processing, analyzing, and manipulating images using NumPy arrays. To load an image in Mahotas, you can use the mahotas.imread() function, which reads the image from disk and returns it as a NumPy array.
Note: Mahotas is no longer actively maintained and may not support the latest Python versions. For new projects, consider using OpenCV, scikit-image, or Pillow instead.
import mahotas
import matplotlib.pyplot as plt

image = mahotas.imread("rose.jpg")
plt.imshow(image)
plt.axis("off")
plt.show()
Output

Explanation:
- mahotas.imread() reads the image from the specified file path.
- The loaded image is stored as a NumPy array.
- plt.imshow() displays the image.
- plt.axis("off") hides the axis for a cleaner display.
- plt.show() renders the image.
Syntax
The imread() function is used to load an image from a file:
mahotas.imread(filename)
- Parameter: filename - Path or name of the image file to be loaded.
- Return Value: Returns a NumPy ndarray containing the image pixel data.
Examples
Example 1: After loading an image, you can check its dimensions, number of color channels, and data type.
import mahotas

image = mahotas.imread("sample.jpg")
print("Image Shape:", image.shape)
print("Data Type:", image.dtype)
Output
Image Shape: (720, 1280, 3)
Data Type: uint8
Explanation:
- image.shape returns the height, width, and number of color channels.
- image.dtype returns the data type used to store pixel values.
- Most color images are stored as uint8, where pixel values range from 0 to 255.
Example 2: Mahotas can also load grayscale images, which contain only intensity values instead of RGB color channels.
import mahotas
import matplotlib.pyplot as plt

image = mahotas.imread("bear.png")
plt.imshow(image, cmap="gray")
plt.axis("off")
plt.show()
Output
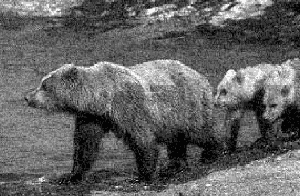
Explanation:
- mahotas.imread() loads the grayscale image.
- cmap="gray" displays the image using grayscale colors.
- plt.axis("off") removes the axis around the image.
- plt.show() displays the final output.
