
A pie chart is a circular graph used to represent data as slices of a circle, where each slice corresponds to a category's proportion of the whole. It is commonly used to compare the percentage or share of different categories in a dataset.
Example: The following example creates a simple pie chart showing the distribution of four categories.
import matplotlib.pyplot as plt

labels = ["A", "B", "C", "D"]
values = [30, 25, 20, 25]

plt.pie(values, labels=labels)
plt.title("Simple Pie Chart")
plt.show()
Output
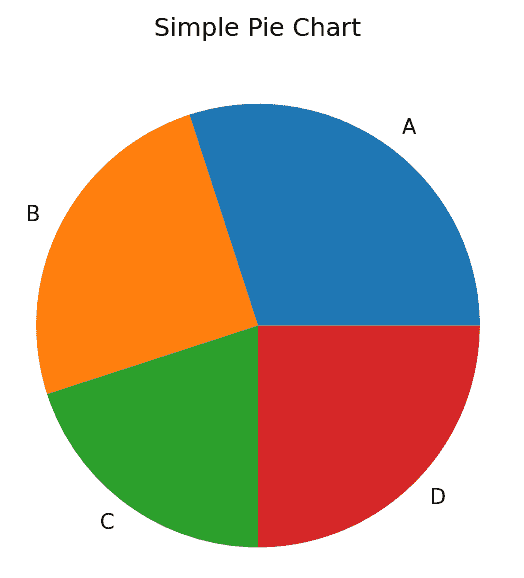
Explanation:
- pie() function creates a pie chart using the given values. Each value determines the size of its corresponding slice, while the labels parameter displays the category names on the chart.
- title() function adds a title to the visualization.
Syntax
matplotlib.pyplot.pie(x, labels=None, colors=None, autopct=None, explode=None, startangle=0, shadow=False)
Parameters:
- x: Specifies the numerical values used to determine the size of each pie slice.
- labels: Specifies the labels displayed for each slice.
- colors: Specifies the colors of the pie slices.
- autopct: Displays the percentage value on each slice using a specified format (for example, "%1.1f%%").
- explode: Separates one or more slices from the center of the pie chart.
- startangle: Rotates the starting position of the pie chart by the specified angle.
- shadow: If set to True, adds a shadow effect below the pie chart.
Why Use Pie Charts?
Pie charts provide a visual representation of data that makes it easy to compare parts of a whole. They are particularly useful when:
- Displaying relative proportions or percentages.
- Summarizing categorical data.
- Highlighting significant differences between categories.
However, while pie charts are useful, they also have limitations. They can become cluttered with too many categories or lead to misinterpretation if not designed thoughtfully. Despite this, a well-crafted pie chart using Matplotlib can significantly enhance the presentation of your data.
Customizing a Pie Chart
Matplotlib provides several options to customize the appearance of a pie chart. You can rotate the chart, separate slices, display percentages, apply custom colors, add shadows and modify the slice borders to create more informative and visually appealing charts.
import numpy as np
import matplotlib.pyplot as plt

cars = ['AUDI', 'BMW', 'FORD','TESLA', 'JAGUAR', 'MERCEDES']
data = [23, 17, 35, 29, 12, 41]
explode = (0.1, 0.0, 0.2, 0.3, 0.0, 0.0)
colors = ("orange", "cyan", "brown", "grey", "indigo", "beige")
wp = {'linewidth': 1, 'edgecolor': "green"}

def func(pct, allvalues):
    absolute = int(pct / 100.*np.sum(allvalues))
    return "{:.1f}%\n({:d} g)".format(pct, absolute)

fig, ax = plt.subplots(figsize=(10, 7))
wedges, texts, autotexts = ax.pie(data,
                                  autopct=lambda pct: func(pct, data),
                                  explode=explode,
                                  labels=cars,
                                  shadow=True,
                                  colors=colors,
                                  startangle=90,
                                  wedgeprops=wp,
                                  textprops=dict(color="magenta"))

ax.legend(wedges, cars,
          title="Cars",
          loc="center left",
          bbox_to_anchor=(1, 0, 0.5, 1))

plt.setp(autotexts, size=8, weight="bold")
ax.set_title("Customizing pie chart")
plt.show()
Output

Explanation:
- This example customizes the pie chart by separating selected slices using explode, rotating the chart with startangle, applying custom colors, adding a shadow effect and displaying formatted percentage labels using autopct.
- The wedgeprops parameter customizes the slice borders, while a legend and title improve the readability and presentation of the chart.
Creating a Nested Pie Chart
A nested pie chart displays data in multiple levels, making it useful for visualizing categories and their corresponding subcategories. It is created by drawing multiple pie layers with different radii in the same figure.
from matplotlib import pyplot as plt
import numpy as np

size = 6
cars = ['AUDI', 'BMW', 'FORD', 'TESLA', 'JAGUAR', 'MERCEDES']
data = np.array([[23, 16], [17, 23],
                 [35, 11], [29, 33],
                 [12, 27], [41, 42]])

norm = data / np.sum(data)*2 * np.pi
left = np.cumsum(np.append(0, norm.flatten()[:-1])).reshape(data.shape)
cmap = plt.get_cmap("tab20c")
outer_colors = cmap(np.arange(6)*4)
inner_colors = cmap(np.array([1, 2, 5, 6, 9,
                              10, 12, 13, 15,
                              17, 18, 20]))

fig, ax = plt.subplots(figsize=(10, 7), subplot_kw=dict(polar=True))
ax.bar(x=left[:, 0],
       width=norm.sum(axis=1),
       bottom=1-size,
       height=size,
       color=outer_colors,
       edgecolor='w',
       linewidth=1,
       align="edge")

ax.bar(x=left.flatten(),
       width=norm.flatten(),
       bottom=1-2 * size,
       height=size,
       color=inner_colors,
       edgecolor='w',
       linewidth=1,
       align="edge")

ax.set(title="Nested pie chart")
ax.set_axis_off()
plt.show()
Output
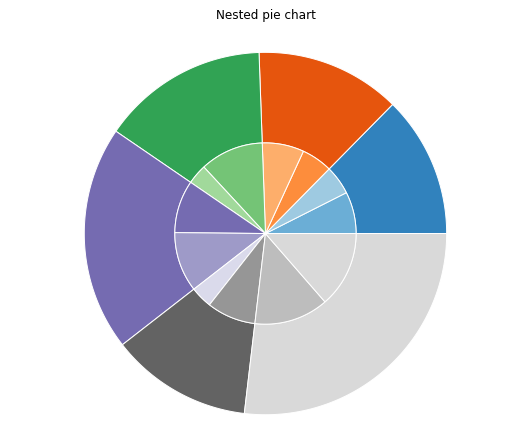
Explanation:
- This example creates a two-level pie chart by drawing two circular layers using a polar plot. The outer layer represents the main categories, while the inner layer represents their corresponding subcategories.
- Different color palettes distinguish the two levels, and removing the axes produces a clean, pie chart-like visualization.
