
Scientific computing with Python involves using Python and its libraries to perform mathematical computations, data analysis, simulations, and visualization. It provides a powerful and efficient environment for solving scientific and engineering problems.
- Performs numerical computations and mathematical modelling
- Uses libraries like NumPy, SciPy and Matplotlib for scientific tasks
- Supports data analysis, simulations, and visualisation
- Widely used in research, engineering, machine learning and data science
Scientific Computing Workflow
Scientific computing projects generally follow a series of steps to transform raw data into meaningful insights and results. This workflow can vary depending on the application, but these steps form the foundation of most scientific computing projects.
- Collect or Generate Data: Gather data from experiments, simulations, sensors, or external datasets.
- Process and Clean Data: Remove inconsistencies, handle missing values, and prepare the data for analysis.
- Perform Numerical Computations: Apply mathematical models, statistical methods, or simulations to solve scientific problems.
- Visualise the Results: Create graphs, charts, and plots to better understand and communicate findings.
- Build Predictive Models (Optional): Use machine learning techniques to make predictions or identify patterns in data.
- Interpret and Present Results: Analyze the outcomes and present conclusions for research, engineering, or decision-making purposes.
Python Libraries for Scientific Computing
Examples of key libraries used for Scientific Computing are given below. Install these libraries by using the following command:
pip install numpy scipy matplotlib pandas scikit-learn
1. NumPy
NumPy is the foundational library for numerical computing in Python. It provides support for large, multi-dimensional arrays and matrices, along with a collection of mathematical functions to operate on these arrays. It is used in Linear algebra, Fourier transforms, and random number generation.
import numpy as np

arr = np.array([1, 2, 3, 4])
print("Sum:", np.sum(arr))
print("Mean:", np.mean(arr))
Output
Sum: 10
Mean: 2.5
2. SciPy
Built on top of NumPy, SciPy adds more advanced scientific computing functionality. It contains modules for optimization, integration, interpolation, eigenvalue problems, and other tasks commonly used in scientific computations. It is used in Numerical integration, optimization problems, signal processing, etc.
from scipy import integrate
result = integrate.quad(lambda x: x**2, 0, 1)
print(result)
Output
(0.33333333333333337, 3.700743415417189e-11)
Explanation:
integrate.quad()numerically evaluates a definite integral.lambda x: x**2defines the function x^2.0and1specify the integration limits.- The first value is the result of the integration, while the second value is the estimated error.
3. Matplotlib
Matplotlib is a comprehensive library for creating static, animated, and interactive visualizations in Python. It is widely used for plotting graphs, charts, and scientific plots. It is used for Visualizing data, plotting functions, creating histograms, etc.
import matplotlib.pyplot as plt
x = np.linspace(0, 10, 100)
y = np.sin(x)
plt.plot(x, y)
plt.show()
Output:
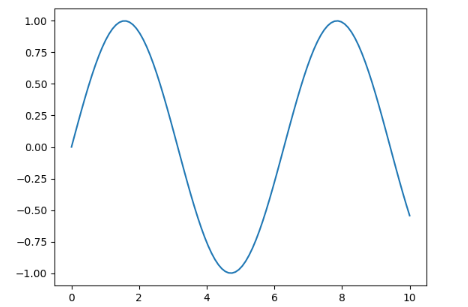
Explanation:
- np.linspace() generates evenly spaced values.
- np.sin() computes the sine of each value.
- plt.plot() creates a line graph.
- plt.show() displays the plot.
4. Pandas
Pandas is essential for data manipulation and analysis. It provides data structures like DataFrames, which are perfect for handling structured data and performing tasks like grouping, aggregating, and cleaning data. It is used for Data manipulation, time-series analysis, and data cleaning.
import pandas as pd
data = {'name': ['Alice', 'Bob'], 'age': [25, 30]}
df = pd.DataFrame(data)
print(df)
Output:
name age
0 Alice 25
1 Bob 30
Explanation:
- pd.DataFrame() creates a DataFrame from a dictionary.
- The keys (name and age) become column names.
- Each list inside the dictionary becomes a column of data.
- print(df) displays the DataFrame in a tabular format.
5. TensorFlow and PyTorch
Both TensorFlow and PyTorch are deep learning frameworks used for scientific computing. They offer highly optimized computation graphs for performing large-scale numerical computations, especially in machine learning and neural network training. Mainly used for Machine learning, deep learning, and artificial intelligence.
Install these by using the following command:
pip install torch tensorflow
import torch
x = torch.tensor([1.0, 2.0, 3.0])
print(x ** 2)
Output:
tensor([1., 4., 9.])
Explanation:
- torch.tensor() creates a tensor, which is PyTorch's primary data structure for numerical computations.
- x ** 2 performs element-wise squaring of each tensor value.
Applications
| Domain | Common Libraries |
|---|---|
| Data Science | Pandas, NumPy, Matplotlib |
| Physics & Engineering | SciPy, SymPy |
| Machine Learning | TensorFlow, PyTorch, scikit-learn |
| Bioinformatics | Biopython, scikit-bio |
| Geospatial Analysis | GeoPandas, Shapely |
