

Outliers are data points that differ significantly from the rest of the dataset. These extreme values may occur due to measurement errors, incorrect data entry or rare events. Detecting and handling outliers is an important step in data preprocessing and statistical analysis.
Impact of Outliers on Models
Outliers can have several detrimental effects on the performance and accuracy of machine learning models:
- Skewed Data Distribution: Outliers can distort the shape of the data, making it unrepresentative of the underlying trend.
- Distorted Statistical Metrics: They can alter essential statistics, such as the mean, variance and standard deviation, leading to inaccurate conclusions.
- Biased Model Accuracy: Outliers can bias the model, reducing its ability to generalize to new data and impacting overall prediction accuracy.
Implementation of Outlier Detection
We will explore different methods to detect and remove outliers present in a given dataset.
1. Create Data with Outliers
We will create a sample data containing the outliers inside it using the rnorm() function and generating 500 different data points. Further, we will be adding 10 random outliers to this data.
data <- rnorm(500)
data[1:10] <- c(46,9,15,-90,
         42,50,-82,74,61,-32)
2. Visualizing Outliers Using Boxplot
We use the boxplot() function to visualize outliers. Outliers are identified as points outside the "whiskers" of the boxplot.
boxplot(data)
Output:
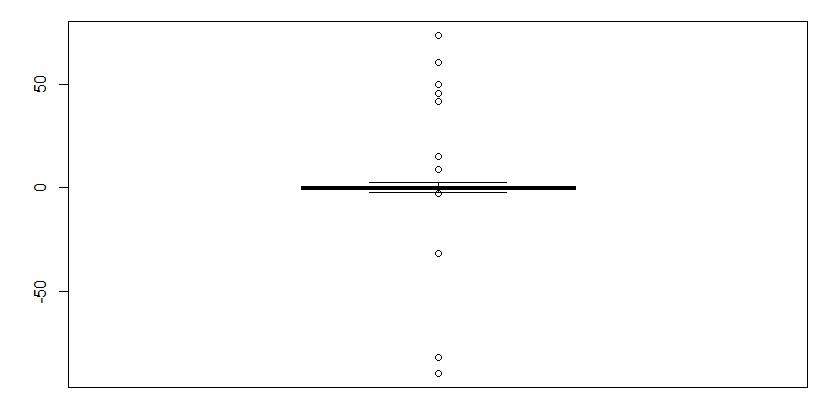
3. Removing Outliers
We will remove the outlier using the boxplot.stats() function, which returns outlier values. The !data %in% condition removes these outliers from the data.
newdata <- data[!data %in% boxplot.stats(data)$out]
4. Verifying Outlier Removal
We will just verify if the outlier has been removed from the data simply by plotting the boxplot again.
boxplot(newdata)
Output:
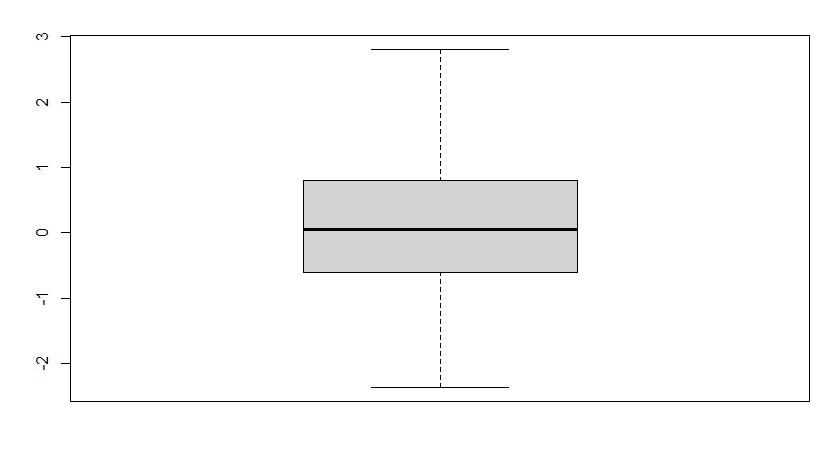
As we can see in the output plot that there is no outlier plotted in the plot. so, we successfully analyzed and remove the outlier.
5. Detecting Outliers Using Histogram
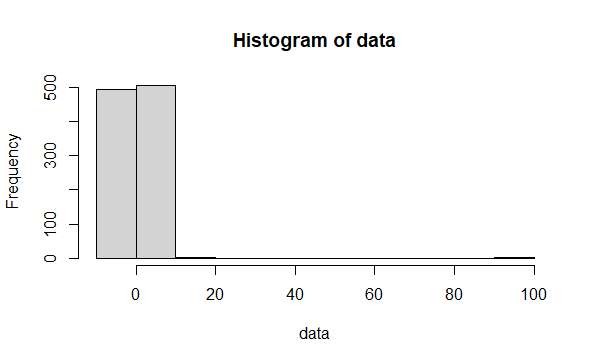
Histograms are another way to detect outliers visually. Here, we create a dataset with random outliers and plot a histogram.
set.seed(123)
data <- c(rnorm(1000), 10, 15, 12, 100)

hist(data)
Output:
6. Detecting and Removing Outliers from Multiple Columns
The Interquartile Range (IQR) method detects outliers using the rule:
- Values > Q3 + 1.5 × IQR or
- Values < Q1 − 1.5 × IQR are considered outliers.
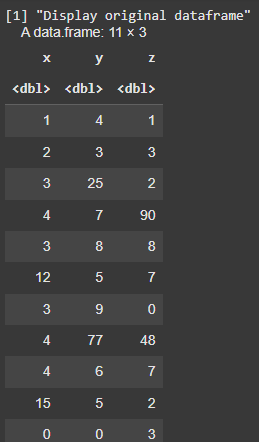
sample_data <- data.frame(
  x=c(1,2,3,4,3,12,3,4,4,15,0),
  y=c(4,3,25,7,8,5,9,77,6,5,0),
  z=c(1,3,2,90,8,7,0,48,7,2,3)
)
sample_data
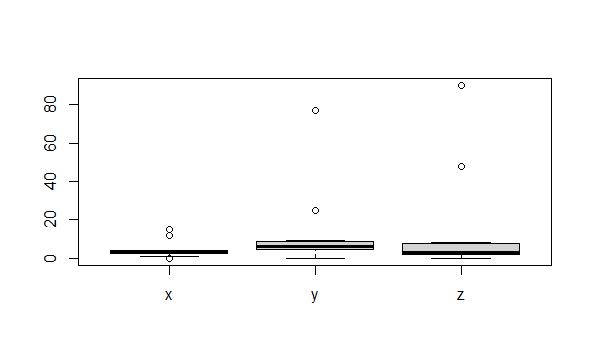
boxplot(sample_data)
Output:
Function to Detect Outliers
detect_outlier <- function(x){
  Q1 <- quantile(x, 0.25, na.rm = TRUE)
  Q3 <- quantile(x, 0.75, na.rm = TRUE)
  IQR <- Q3 - Q1
  x > Q3 + 1.5 * IQR | x < Q1 - 1.5 * IQR
}
Function to Remove Outliers
remove_outlier <- function(dataframe,columns=names(dataframe)){
  for(col in columns){
    dataframe <- dataframe[!detect_outlier(dataframe[[col]]),]
  }
  dataframe
}
Apply the Function
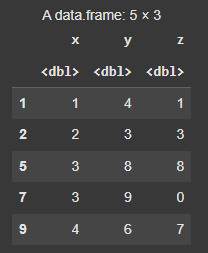
remove_outlier(sample_data,c("x","y","z"))
Output:
You can download the source code from here.
