

An OLA Data Analysis project is a SQL-based project used to analyze ride-booking data and gain useful insights.
- Uses MySQL to store and manage OLA booking data.
- Uses SQL to analyze bookings and generate meaningful insights.
- Supports analysis of customers, vehicle types, cancellations, ratings, payment methods, ride distance and booking value.
- Helps understand booking patterns and customer and driver behavior.
Creating the OLA Database & Tables
Firstly, use MySQL Workbench to import the OLA booking data from the CSV file, create the ola_db database in MySQL, define the required table and verify the database setup.
Query:
CREATE DATABASE oladb;USE oladb;After creating the database, import the Bengaluru_Ola_Booking_Data.csv file using the Table Data Import Wizard in MySQL Workbench and create the table ola_booking_table.
To verify the database setup:
SHOW TABLES;You can download the dataset from the GitHub Repository.
Data Constraints & Project Goals
- Booking Status: 62% of the rides should have a "Success" status with the remaining 38% being cancellations.
- Cancelled Rides by Customer: No more than 7% of the bookings should be cancelled by customers.
- Cancelled Rides by Driver: No more than 18% of the bookings should be cancelled by drivers.
- Incomplete Rides: The percentage of incomplete rides should be under 6%.
- Weekend and Match Day Orders: The number of orders should be higher on weekends and match days. I marked specific dates as match days.
- Order Values: Around 70% of orders should have a fare under ₹500, while 28% should be above ₹500, with the remainder above ₹100.
- Food Category: The dataset reflects 67% of orders being from the food category, a common service in Bengaluru.
Data Preparation with SQL
Let's perform an Exploration Data Analysis (EDA) to find insight that can help to take decisions:
Query 1. Retrieve all successful bookings
SELECT `Booking ID`,`Booking Status`,`Customer ID`,`Vehicle Type`FROM ola_booking_tableWHERE `Booking Status` = 'Success'LIMIT 10;
Output:
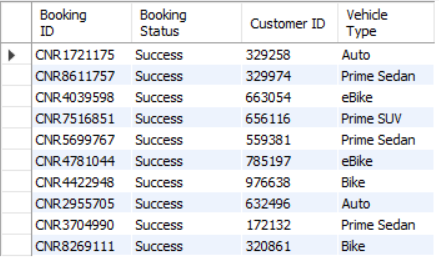
- This query retrieves the booking details of successful rides, providing insights into completed bookings.
Query 2. Find the average ride distance for each vehicle type
SELECT `Vehicle Type`,AVG(`Ride Distance`) AS avg_distanceFROM ola_booking_tableGROUP BY `Vehicle Type`;
Output:
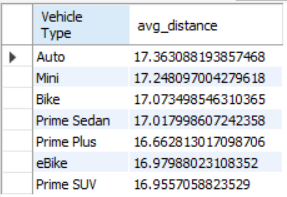
- This query calculates the average ride distance for each vehicle type, helping analyze ride patterns across different vehicle categories.
Query 3. Get the total number of cancelled rides by customers
SELECT COUNT(*)FROM ola_booking_tableWHERE `Booking Status` = 'Cancelled by Customer';
Output:
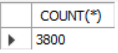
- This query counts the total number of rides cancelled by customers, helping analyze customer cancellation trends.
Query 4. List the top 5 customers who booked the highest number of rides
SELECT `Customer ID`,COUNT(`Booking ID`) AS total_ridesFROM ola_booking_tableGROUP BY `Customer ID`ORDER BY total_rides DESCLIMIT 5;
Output:
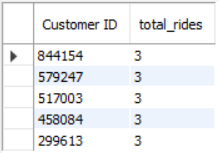
- This query identifies the top 5 customers based on the number of rides booked, highlighting the most active customers.
Query 5
SELECT COUNT(*)FROM ola_booking_tableWHERE `Cancelled Rides by Driver` = 'Personal & Car related issue';
Output:
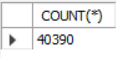
- This query calculates the number of rides cancelled by drivers due to personal or car-related issues.
Query 6
SELECT MAX(`Driver Ratings`) AS max_rating,MIN(`Driver Ratings`) AS min_ratingFROM ola_booking_tableWHERE `Vehicle Type` = 'Prime Sedan';
Output:
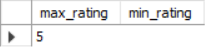
- This query finds the highest and lowest driver ratings for Prime Sedan bookings.
Query 7
SELECT `Booking ID`, `Vehicle Type`, `Payment Method`, `Booking Value`
FROM ola_booking_table
WHERE `Payment Method` = 'UPI'
LIMIT 10;
Output:
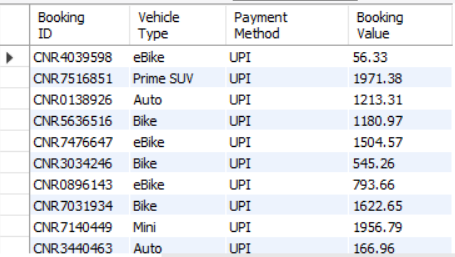
- This query retrieves all rides where the payment method was UPI.
Query 8
SELECT `Vehicle Type`,AVG(`Customer Rating`) AS avg_customer_ratingFROM ola_booking_tableGROUP BY `Vehicle Type`;
Output:
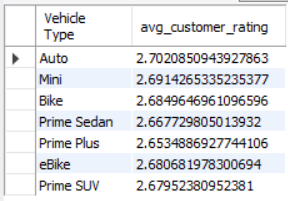
- This query calculates the average customer rating for each vehicle type.
Query 9
SELECT SUM(`Booking Value`) AS total_successful_valueFROM ola_booking_tableWHERE `Booking Status` = 'Success';
Output:
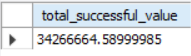
- This query calculates the total booking value of successfully completed rides.
Query 10
SELECT `Booking ID`, `Reason for Cancelling by Driver`FROM ola_booking_tableWHERE `Reason for Cancelling by Driver` IS NOT NULLLIMIT 5;
Output:
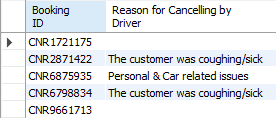
- This query lists bookings where the driver cancelled the ride, along with the reason provided for the cancellation.
Advanced Data Analysis With Dashboard Creation
The Power BI dashboard presents key OLA booking insights through the following visuals:
Key Performance Indicators (KPIs)
KPIs help measure ride-booking performance and business outcomes. The primary KPIs in this dashboard are:
- Total Booking Value: Shows the total value generated from bookings.
- Total Rides: Shows the total number of rides booked.

Booking Value by Vehicle Type
The stacked column chart shows the total booking value for each vehicle type.
- X-axis: Vehicle Type
- Y-axis: Total Booking Value

Revenue by Payment Method
The stacked bar chart shows the total revenue generated through different payment methods, such as Cash, UPI and Credit Card.
- X-axis: Payment Method
- Y-axis: Total Booking Value
Customer Spending Leaderboard
The leaderboard visual shows the top customers based on their total spending on bookings.
- X-axis: Customer ID
- Y-axis: Total Booking Value
Ride Distance Distribution
The histogram shows the distribution of ride distances, helping identify the most common ride-distance ranges.
- X-axis: Ride Distance
- Y-axis: Number of Rides

Reason for Cancelling Ride Either by Customer or Driver
The pie chart shows the distribution of ride cancellation reasons for both customers and drivers.
- Customer Cancellation: Driver is not moving towards pickup location
- Driver Cancellation: Personal & Car related issues

Customer Rating and Driver Rating
The bar chart shows the distribution of customer ratings and driver ratings across different vehicle types.
- Customer Rating: Shows the ratings given by customers based on their ride experience.
- Driver Rating: Shows the ratings given by drivers based on customer behaviour during the ride.

Insights
- Booking Metrics: The dashboard displays total bookings, total booking value and total ride distance through KPI cards.
- Date Analysis: Users can use the date slicer to filter data for a selected time period.
- Performance Trends: Charts help visualize booking trends over time.
- Interactive Analysis: The dashboard allows users to track performance and identify booking patterns efficiently.

