
Tableau is a data visualization and business intelligence tool that helps users analyze and present data in an interactive visual format without coding. It converts raw data into meaningful visual insights that make analysis faster and easier for decision-making.
- Works with multiple data sources such as spreadsheets, databases, and cloud platforms, allowing flexible data connectivity.
- Provides a drag-and-drop interface that enables users to create visualizations without programming knowledge.
- Supports interactive dashboards with real-time data exploration using charts, filters, and graphs.
Products Offered
- Tableau Desktop: A powerful tool used to create and design visualizations, reports, and dashboards. It allows users to connect to various data sources and perform in-depth analysis using a drag-and-drop interface.
- Tableau Public: A free version of Tableau that allows users to create visualizations and publish them online. It is mainly used for learning and sharing dashboards publicly.
- Tableau Server: An enterprise-level platform used to securely share, manage, and collaborate on dashboards within an organization. It enables controlled access to data and reports.
- Tableau Online: A cloud-hosted version of Tableau Server that removes the need for on-premise infrastructure. It allows users to access and share dashboards from anywhere.
Working
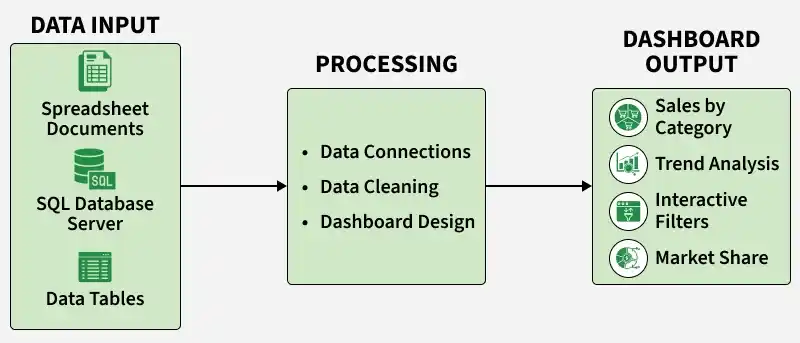
Tableau works by converting raw data into interactive visual insights through a simple analytical workflow.
- Connects to data sources such as Excel, databases, or cloud platforms.
- Processes and organizes the data for visualization.
- Builds visualizations using a drag-and-drop interface without coding.
- Combines multiple visuals into interactive dashboards.
- Enables users to explore, filter, and share insights easily.
Types of Visualizations
Tableau provides various visualization types to represent data effectively based on different analytical needs.
- Bar Charts: Used to compare values across categories using rectangular bars. They are commonly used for simple and clear comparisons.
- Line Charts: Used to show trends and changes over time. They help in analyzing continuous data patterns.
- Pie Charts: Used to represent data as proportions or percentages of a whole. They are useful for showing category-wise distribution.
- Maps: Used for geographic data visualization. They help in analyzing data based on locations.
- Heat Maps: Used to represent data intensity using colors. They help in identifying patterns and variations quickly.
For more details please refer to: Types of Visualizations in Tableau
Business Benefits of Tableau
Tableau provides practical advantages to organizations by improving how data is used in decision-making and operations.
- Data-Driven Decision Making: Helps organizations use real-time data insights to make faster and more accurate decisions.
- Performance Monitoring: Enables continuous tracking of business metrics through interactive dashboards.
- Customer and Market Analysis: Assists in understanding customer behavior, sales trends, and market performance for strategic planning.
- User-Friendly for Teams: Allows both technical and non-technical users to build and explore dashboards using a simple drag-and-drop interface.
Applications
- Business Intelligence: Used to create dashboards and reports for tracking business performance and KPIs.
- Marketing Analytics: Helps analyze customer behavior, campaign performance, and market trends.
- Finance and Banking: Used for financial reporting, risk analysis, and fraud detection.
- Healthcare: Helps in analyzing patient data, hospital performance, and medical trends.
- Education: Used for tracking student performance and institutional data analysis.
Advantages
- Helps transform complex datasets into simple and interactive visual insights for better understanding.
- Improves the overall speed of analyzing data compared to traditional reporting methods.
- Makes data interpretation easier for users by reducing dependence on technical skills.
- Enhances communication of insights through clear visual reports and dashboards.
Limitations
- Tableau can be expensive for individual users and small organizations due to licensing costs.
- It may require strong data preparation skills for handling complex datasets.
- Performance can slow down when working with very large or unoptimized datasets.
- Advanced analytics features may require integration with other tools or scripting languages.
