A flaky test rarely breaks production. Instead, it quietly taxes every pull request your team opens.
The Hidden Tax
Every team knows the moment. A build turns red, someone shrugs, and the pipeline is simply run again. It passes, and everyone moves on. That small shrug is where the money leaks away, because each rerun costs minutes of waiting, a context switch, and a little more distrust in the suite.
This article puts numbers on that tax. First, we look at what published research says. Then we use simple math to show why even tiny flake rates matter at scale.
What the Research Actually Says
Google’s Numbers
In a May 2016 post on the Google Testing Blog, Google reported that about 1.5% of all its test runs show a flaky result, meaning the same code both passed and failed. It also found that almost 16% of its tests have some level of flakiness. In the post’s own example, a flaky rate of 1.5% means that about 15 tests will likely fail in a batch of 1,000, and each failure needs investigation by a build cop or developer.
One caution is worth making here. You may have seen the “16%” quoted as the share of developer time lost to flaky tests. That reading is wrong. The 16% describes the share of tests with some flakiness, not time. Please check any article that repeats it as a time figure.
What Causes Them
Next, why do tests flake? A well-known study by Luo, Hariri, Eloussi and Marinov, An Empirical Analysis of Flaky Tests (FSE 2014), examined 201 fixes in open-source projects. Its top three categories are shown below. As co-author Lamyaa Eloussi summarised on the Salesforce engineering blog, they cover most of the cases.
| Cause | Share of fixes | Typical remedy found in the study |
|---|---|---|
| Async wait | 45% | 54% were fixed by waiting for the result instead of sleeping |
| Concurrency | 20% | Data races, atomicity bugs and deadlocks |
| Test order dependency | 12% | 74% were fixed by cleaning shared state |
| Everything else | 23% (remainder) | Network, time, unordered collections, and more |
In short, most flakes are bugs in the tests themselves. Consequently, they are fixable engineering work, not bad luck.
Why Small Rates Add Up Fast
Here is the part that surprises people. A suite passes only if every test passes. So if each test flakes with probability p, a suite of n tests is green with probability (1 – p) to the power n, when the code is correct. A quick check: a 0.05% flake rate across 100 tests gives a green run about 95% of the time.
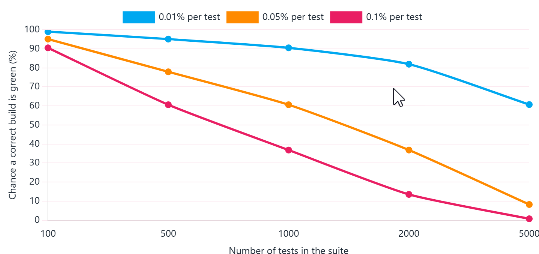
Look at the orange line. With a seemingly harmless 0.05% rate per test, a 2,000-test suite is green only about 37% of the time. Therefore, the bigger the suite, the more a tiny rate hurts.
A Simple Cost Model
Now let us turn those probabilities into hours. The assumptions below are mine, not measured data, so please replace them with your own numbers. I assumed 20 developers, 4 CI runs per developer per day, 230 working days, a 2,000-test suite, and 30 minutes lost for each false red build. I also assumed no automatic retry.
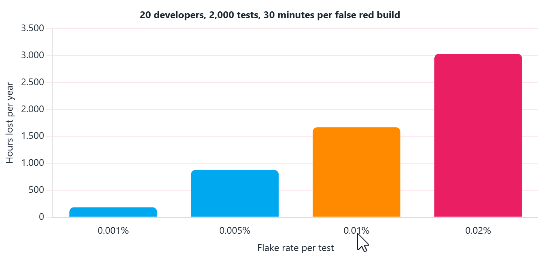
| Per-test flake rate | False red builds | Hours lost per year | Share of team capacity |
|---|---|---|---|
| 0.001% | 2% of runs | 182 | 0.5% |
| 0.005% | 9.5% of runs | 876 | 2.4% |
| 0.01% | 18.1% of runs | 1,668 | 4.5% |
| 0.02% | 33.0% of runs | 3,033 | 8.2% |
Capacity here means 20 developers times 230 days times 8 hours, or 36,800 hours. Even the modest 0.01% row costs about 1,668 hours, or roughly 208 working days, every year.
The model also leaves out two costs that are harder to count. One is the cost of ignored failures, because people who expect a flake may dismiss a real bug. The other is infrastructure. A research paper from George Mason University, Root Causing Flaky Tests in a Large-Scale Industrial Setting, reports Google spending roughly 2 to 16% of its testing budget on reruns. It cites another source for that range, and I could not trace the original, so treat it as approximate.
What to Do About It
Google’s post describes the tools it uses: rerunning only failed tests, automatic reruns, and a tool that quarantines a test when its flakiness grows too high. A test can also be marked flaky, so that it must fail three times in a row before a failure is reported. These are good first aid. However, reruns hide the cost instead of removing it, so the real fix is to repair the cause.
Quick checklist
- Measure first: record every rerun and tag each failure as real, flaky or unknown.
- Quarantine proven flakes quickly, and file a ticket for each one.
- Replace sleeps with waits for a condition.
- Make every test create and clean its own data.
- Run tests in random order now and then to expose hidden dependencies.
What We Have Learned
Flaky tests are a recurring tax, not a rare nuisance. Google reports about 1.5% of test runs as flaky and almost 16% of tests as touched by flakiness, and the 16% is a share of tests, not of time. Because a suite is green only when every test passes, a tiny per-test rate compounds quickly: at 0.05% per test, a 2,000-test suite is green about 37% of the time. In my illustrative model, a 0.01% rate costs a 20-person team around 1,668 hours a year. Since the best-known study traces most flakes to async waits, concurrency and test order, the cure is mostly better tests. So measure your own reruns, quarantine fast, and fix the cause.