
Test of significance is a process for comparing observed data with a claim (also called a hypothesis), the truth of which is being assessed in further analysis.
Statistical methods used to determine whether the results of a study are real and meaningful or have occurred simply by chance.
- Helps determine whether there is sufficient evidence to reject the null hypothesis.
- Measures the reliability and validity of the study results.
- Reduces the possibility of making conclusions based on random variation.
Process of Significance Testing
In the process of testing for statistical significance, the following steps must be taken:
Step 1: Start by coming up with a research idea or question for your thesis.
Step 2: Formulate the null hypothesis (H0) and alternative hypothesis (H1).
Step 3: Decide on the significance level (α) you need for your results, such as 0.05 or 0.01, which serves as the threshold for rejecting the null hypothesis.
Step 4: Choose the appropriate statistical test to analyze your data accurately.
Step 5: Understand and explain what your results mean in the context of your research question.
There are two main types of errors in hypothesis testing:
Type I Error (False Positive): Occurs when the null hypothesis (H₀) is rejected even though it is true. This means the researcher concludes that there is a significant effect, difference, or relationship when, in reality, no such effect exists. It is called a false positive and is represented by α (alpha), the significance level.
Type II Error (False Negative): Occurs when the null hypothesis (H₀) is not rejected even though it is false. This means the researcher fails to identify a significant effect, difference, or relationship that actually exists. It is called a false negative and is represented by β (beta).
Statistical Tests
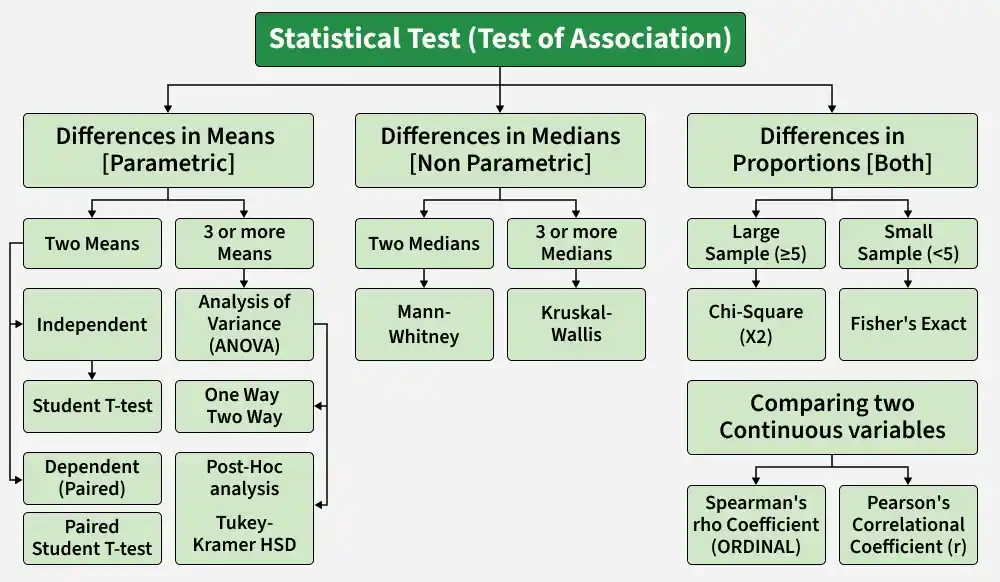
Statistical tests are used in hypothesis testing to determine whether the results obtained from a sample are statistically significant. Depending on the research hypothesis, either a one-tailed test or a two-tailed test is applied.
The image below presents the selection of statistical tests based on data characteristics and study requirements:
One-Tailed Test
A one-tailed test is used when the researcher expects a change or effect in only one specific direction. It examines whether the parameter is significantly greater than or less than a specified value.
Example: Testing whether a new drug improves patient recovery rates.
Two-Tailed Test
A two-tailed test is used when the researcher considers changes in both directions to be possible. It examines whether the parameter is significantly different from a specified value, regardless of the direction of the difference.
Example: Testing whether a new teaching method affects student performance, either positively or negatively.
Note: The term “tail” refers to the extreme ends of a probability distribution. The choice between a one-tailed and two-tailed test depends on the research objective and the nature of the hypothesis being tested.
p-Value Testing
The p-value is an important concept in hypothesis testing that helps determine the statistical significance of the observed results. It represents the probability of obtaining results as extreme as those observed, assuming that the null hypothesis (H₀) is true.
Before conducting a statistical test, a significance level (α) is selected, commonly 0.05 (5%) or 0.01 (1%). This value serves as the threshold for making decisions about the hypothesis.
- If p-value ≤ α, the null hypothesis is rejected, indicating that the results are statistically significant.
- If p-value > α, the null hypothesis is not rejected, indicating that there is insufficient evidence to support the alternative hypothesis.
Thus, the p-value helps researchers assess whether the observed findings are likely due to chance or represent a genuine effect.
Example on Test of Significance
Some examples of test of significance are added below:
1. T-Test in Medical Research
A t-test is used to compare the means of two groups. For example, researchers may compare the blood pressure of patients receiving a new drug with those receiving a placebo. The test helps determine whether the observed difference is statistically significant.
2. Chi-Square Test in Market Research
A chi-square test is used to examine the relationship between categorical variables. For example, it can determine whether customer satisfaction is associated with product preference.
3. ANOVA in Educational Research
Analysis of Variance (ANOVA) is used to compare the means of three or more groups. For example, it can assess whether different teaching methods lead to significant differences in students' academic performance.
4. Regression Analysis in Economics
Regression analysis is used to study the relationship between variables. For example, researchers may analyze whether advertising expenditure has a significant effect on sales revenue.
5. Paired T-Test in Psychology
A paired t-test is used to compare measurements taken from the same individuals at two different times. For example, it can evaluate whether a therapy program significantly reduces anxiety levels before and after treatment.
Practice Questions
1. A researcher claim that the average heights of adults in a certain country is 175 cm. A random sample of 36 adults from that country has a mean height of 170 cm with a standard deviation of 5 cm. Test the researcher's claim at a significance level of 0.05.
2. A company claims that their new energy drink increases the average running speed of athletes of 2 km/h. A random sample of 20 athletes who consumed the energy drink had an average running speed of 15 km/h with a standard deviation of 1.5 km/h. The average running speed of athletes without the energy drink known to be 13 km/h. Test the company's claim at a significance level of 0.01.
3. A university claims that the average GPA of their students is 3.2. A random sample of 50 students from the university has a mean GPA of 3.05 with a standard deviation of 0.5. Test the university's claim at a significance level of 0.10.
4. A medical researcher claims that a new medications lower the average blood pressure of patients by 5 mmHg. A random sample of 30 patients who took the medication had an average blood pressure of 120 mmHg with a standard deviation of 8 mmHg. The average blood pressure of patients without the medication is known to be 125 mmHg. Test the researcher's claim at a significance level of 0.05.
5. A company claims that their new light blub has an average lifespan of 1000 hours. A random sample of 25 light blubs had an average lifespan of 950 hours with a standard deviation of 50 hours. Test the company's claim at a significance level of 0.01.
