
A Box Plot (also called a Whisker Plot) is used to visualize the distribution of numerical data. It summarizes the data using the minimum value, first quartile (Q1), median, third quartile (Q3), and maximum value, making it easy to identify the spread of data and detect outliers.
Consider a example where we create a basic box plot for a set of values.
import matplotlib.pyplot as plt

data = [12, 15, 18, 21, 24, 26, 28, 30, 35, 40]
plt.boxplot(data)
plt.title("Box Plot")
plt.show()
Output
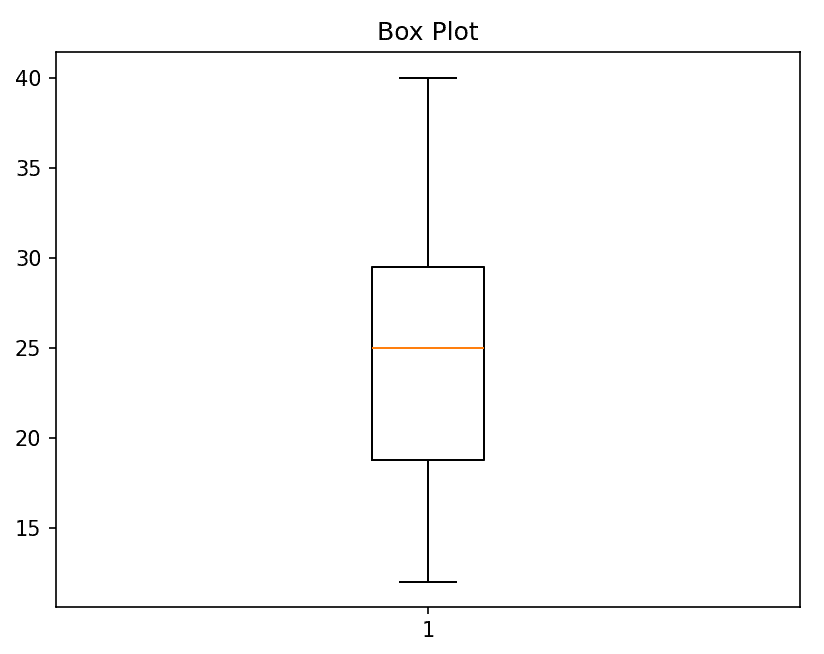
Explanation:
- Creates a box plot for the given numerical values.
- Displays the minimum, first quartile (Q1), median, third quartile (Q3), and maximum values.
- Helps understand the spread and distribution of the dataset.
Syntax
matplotlib.pyplot.boxplot(x, notch=False, vert=True, patch_artist=False, widths=None, labels=None, showmeans=False, showfliers=True)
Parameters:
- x: The dataset to be plotted. It can be a list, tuple, NumPy array, or a sequence of datasets.
- notch (optional): Displays a notch around the median when set to True.
- vert (optional): Plots the box vertically when True and horizontally when False.
- patch_artist (optional): Fills the box with color when set to True.
- widths (optional): Specifies the width of the box plot.
- labels (optional): Adds labels to each box plot.
- showmeans (optional): Displays the mean value of the dataset.
- showfliers (optional): Controls whether outliers are displayed.
Customizing Box Plots
Matplotlib allows you to customize different parts of a box plot to improve its appearance and readability. You can modify the orientation, add notches, fill boxes with colors, change whisker and median styles, and assign custom labels to the datasets.
Some commonly used customization parameters include:
- notch=True: Displays a notch around the median.
- patch_artist=True: Fills the boxes with colors.
- vert=False: Creates a horizontal box plot.
- labels: Assigns custom labels to each box plot.
Example 1: This example creates multiple box plots to compare the distribution of four different datasets.
import matplotlib.pyplot as plt
import numpy as np

np.random.seed(10)

d_1 = np.random.normal(100, 10, 200)
d_2 = np.random.normal(90, 20, 200)
d_3 = np.random.normal(80, 30, 200)
d_4 = np.random.normal(70, 40, 200)
d = [d_1, d_2, d_3, d_4]

fig = plt.figure(figsize =(10, 7))
ax = fig.add_axes([0, 0, 1, 1])
bp = ax.boxplot(d)

plt.show()
Output

Explanation:
- Generates four datasets with different distributions.
- Displays a separate box plot for each dataset.
- Makes it easy to compare the spread, median, and variability of the datasets.
Example 2: This example customizes the box plot by adding notches, colors, horizontal orientation, and modifying the whiskers, median, caps, and outlier markers.
import matplotlib.pyplot as plt
import numpy as np

np.random.seed(10)
d_1 = np.random.normal(100, 10, 200)
d_2 = np.random.normal(90, 20, 200)
d_3 = np.random.normal(80, 30, 200)
d_4 = np.random.normal(70, 40, 200)
d = [d_1, d_2, d_3, d_4]

fig = plt.figure(figsize =(10, 7))
ax = fig.add_subplot(111)
bp = ax.boxplot(d, patch_artist = True, notch ='True', vert = 0)
colors = ['#0000FF', '#00FF00','#FFFF00', '#FF00FF']

for patch, color in zip(bp['boxes'], colors):
    patch.set_facecolor(color)

for whisker in bp['whiskers']:
    whisker.set(color ='#8B008B',
                linewidth = 1.5,
                linestyle =":")

for cap in bp['caps']:
    cap.set(color ='#8B008B',
            linewidth = 2)

for median in bp['medians']:
    median.set(color ='red',
               linewidth = 3)

for flier in bp['fliers']:
    flier.set(marker ='D',
              color ='#e7298a',
              alpha = 0.5)

ax.set_yticklabels(['d_1', 'd_2', 'd_3', 'd_4'])

plt.title("Customized box plot")
ax.get_xaxis().tick_bottom()
ax.get_yaxis().tick_left()
plt.show()
Output
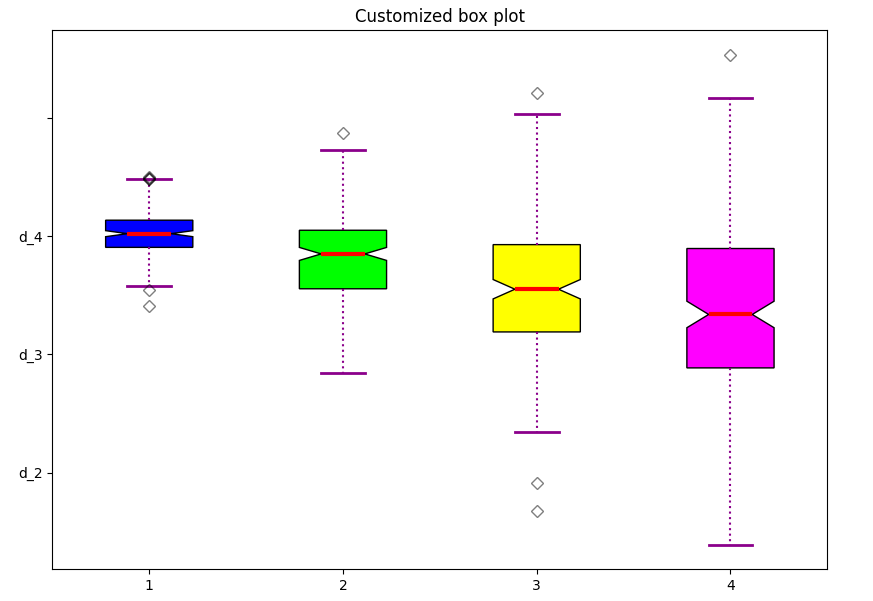
Explanation:
- Displays the box plots horizontally with notches around the median.
- Fills each box with a different color for better distinction.
- Customizes the whiskers, caps, median lines, and outlier markers.
- Adds labels for each dataset and a title to improve readability.
