
Bokeh is a Python library used to create interactive and visually appealing data visualizations for web browsers. It supports a wide range of charts and plots, making it suitable for data analysis, dashboards, and web applications. Bokeh visualizations can be displayed in Jupyter notebooks, standalone HTML files, or Bokeh server applications.
Installation
Before creating visualizations, install Bokeh using the following command:
pip install bokeh
Bokeh provides two main interfaces for creating visualizations:
- bokeh.plotting: A high-level interface for creating common plots quickly using simple functions.
- bokeh.models: A low-level interface that provides advanced customization and greater control over plot elements.
Scatter Plot
A scatter plot displays individual data points and is useful for visualizing the relationship between two numerical variables.
from bokeh.plotting import figure, show

p = figure(width=400, height=400, title="Scatter Plot")
x = [1, 2, 3, 4, 5]
y = [4, 7, 1, 6, 3]
p.scatter(x, y, size=10, color="navy", alpha=0.6)
show(p)
Output
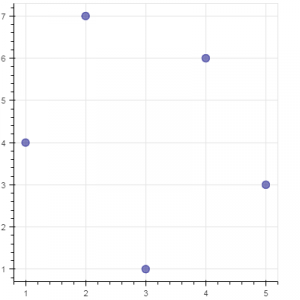
Explanation:
- Creates a figure of size 400 × 400.
- Uses the scatter() method to plot the data points.
- Sets the marker size, color, and transparency.
- Displays the interactive plot.
Line Plot
A line plot connects data points using straight lines and is commonly used to visualize trends.
from bokeh.plotting import figure, show

p = figure(width=400, height=400, title="Line Plot")
x = [1, 2, 3, 4, 5]
y = [3, 1, 2, 6, 5]
p.line(x, y, line_width=2, color="green")

show(p)
Output
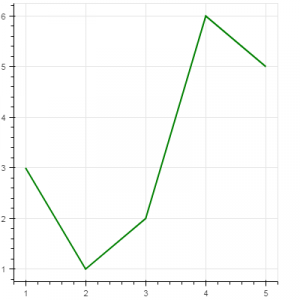
Explanation:
- Creates a line chart using the line() method.
- Specifies the line width and color.
- Displays the chart in the browser.
Bar Chart
A bar chart compares values across different categories.
from bokeh.plotting import figure, show

categories = ["A", "B", "C", "D"]
values = [25, 40, 30, 50]
p = figure(
    x_range=categories,
    width=500,
    height=400,
    title="Sales by Category"
)
p.vbar(x=categories, top=values, width=0.5, color="steelblue")
show(p)
Output
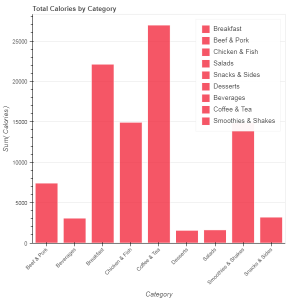
Explanation:
- Creates a categorical x-axis.
- Uses vbar() to draw vertical bars.
- Displays the value for each category.
Box Plot
Bokeh does not provide a built-in boxplot() function like Matplotlib. Box plots are created by calculating the quartiles manually and drawing the components using glyphs.
import pandas as pd
data = pd.DataFrame({"Marks": [45, 52, 58, 60, 63, 67, 72, 75, 80, 90]})
print(data.describe())
Output
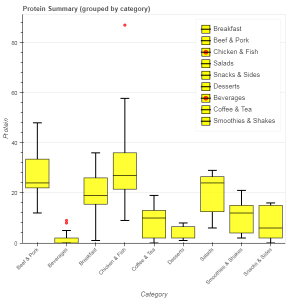
Explanation:
- Creates a sample dataset.
- Calculates the statistical values required for a box plot.
- These values can then be used with Bokeh glyphs to build a customized box plot.
Histogram
A histogram shows how numerical data is distributed across different intervals.
import numpy as np
from bokeh.plotting import figure, show

data = np.random.normal(0, 1, 1000)
hist, edges = np.histogram(data, bins=20)
p = figure(width=500, height=400, title="Histogram")

p.quad(
    top=hist,
    bottom=0,
    left=edges[:-1],
    right=edges[1:],
    fill_color="navy",
    line_color="white"
)

show(p)
Output
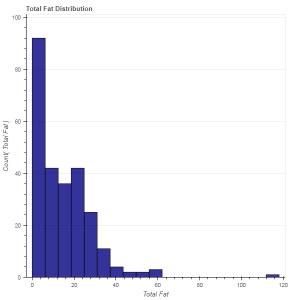
Explanation:
- Generates random data.
- Computes histogram values using NumPy.
- Uses quad() to draw the histogram bars.
- Displays the data distribution.
Scatter Plot with Multiple Variables
Scatter plots can also be used to compare two variables and identify patterns or relationships.
from bokeh.plotting import figure, show
import numpy as np

x = np.random.rand(50)
y = np.random.rand(50)
p = figure(width=400, height=400, title="Scatter Plot")
p.scatter(x, y, size=8, color="orange")
show(p)
Output
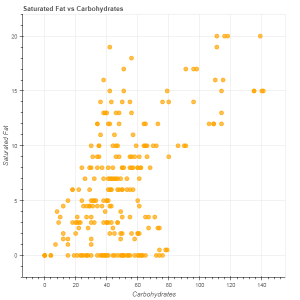
Explanation:
- Generates two sets of random values.
- Plots each (x, y) pair as a point.
- Displays the relationship between the two variables.
